Quickstart for Site Reliability Engineers
Tip
Be sure to first complete one of the K8ssandra install options (locally or on a cloud provider) before performing these post-install steps.In this quickstart for Site Reliability Engineers (SREs), we’ll cover:
- Accessing nodetool commands like status, ring, and info.
- Configure port forwarding for the Prometheus and Grafana monitoring utilities as well as Reaper for Apache Cassandra® (Reaper).
- Accessing the K8ssandra monitoring utilities, Prometheus and Grafana.
- Accessing Reaper, an easy to use repair interface.
- Upgrading a K8ssandra cluster: to ensure you’re using the latest K8ssandra software, or to apply new settings.
Access the Apache Cassandra® nodetool utility
Cassandra’s nodetool utility is commonly used for a variety of monitoring and management tasks. You’ll need to run nodetool on your K8ssandra cluster using the kubectl exec command, because there’s no external standalone option available.
To run nodetool commands:
-
Get a list of the running K8ssandra pods using
kubectl get:kubectl get podsOutput:
NAME                                                READY   STATUS      RESTARTS   AGE
k8ssandra-cass-operator-766849b497-klgwf            1/1     Running     1          45h
k8ssandra-dc1-default-sts-0                         2/2     Running     0          115m
k8ssandra-dc1-stargate-5c46975f66-pxl84             1/1     Running     5          45h
k8ssandra-grafana-679b4bbd74-wj769                  2/2     Running     2          45h
k8ssandra-kube-prometheus-operator-85695ffb-ft8f8   1/1     Running     1          45h
k8ssandra-reaper-655fc7dfc6-n9svw                   1/1     Running     7          45h
k8ssandra-reaper-operator-79fd5b4655-748rv          1/1     Running     0          45h
prometheus-k8ssandra-kube-prometheus-prometheus-0   2/2     Running     3          45h
The K8ssandra pod running Cassandra takes the form
<k8ssandra-cluster-name>-<datacenter-name>-default-sts-<n>and, in the example above isk8ssandra-dc1-default-sts-0which we’ll use throughout the following sections.Tip
Although not applicable to this quick start, additional K8ssandra Cassandra nodes will increment the final<n>but the rest of the name will remain the same. -
Run
nodetool status, using the Cassandra node namek8ssandra-dc1-default-sts-0, and replacing<k8ssandra-username>and<k8ssandra-password>with the values you retrieved in Retrieve K8ssandra superuser credentials:kubectl exec -it k8ssandra-dc1-default-sts-0 -c cassandra -- nodetool -u <k8ssandra-username> -pw <k8ssandra-password> statusOutput:
Datacenter: dc1
===============
Status=Up/Down
|/ State=Normal/Leaving/Joining/Moving
--  Address      Load       Owns    Host ID                               Token                                    Rack
UN  10.244.1.12  215.3 KiB  ?       75e52e51-edc9-49f8-84f6-f044999ac130  -1080085985719557225                     default

Note: Non-system keyspaces don't have the same replication settings, effective ownership information is meaningless
Tip
All nodes should have the statusUNor “Up Normal.”
Other useful nodetool commands include:
-
nodetool ringwhich outputs all the tokens in the node:kubectl exec -it k8ssandra-dc1-default-sts-0 -c cassandra -- nodetool -u <k8ssandra-username> -pw <k8ssandra-password> ringOutput:
Datacenter: dc1 ========== Address Rack Status State Load Owns Token 9126546575375666475 172.17.0.13 default Up Normal 597.42 KiB ? -9138166261715795932 172.17.0.13 default Up Normal 597.42 KiB ? -9120920057340937901 172.17.0.13 default Up Normal 597.42 KiB ? -9117737800555727340 172.17.0.13 default Up Normal 597.42 KiB ? -9058127181143818684 172.17.0.13 default Up Normal 597.42 KiB ? -8998548020695455271 ... -
nodetool infowhich provides load and uptime information:kubectl exec -it k8ssandra-dc1-default-sts-0 -c cassandra -- nodetool -u <k8ssandra-username> -pw <k8ssandra-password> ringOutput:
ID                     : dec6a537-f00c-458a-bbc0-26b173675cc7
Gossip active          : true
Thrift active          : true
Native Transport active: true
Load                   : 597.42 KiB
Generation No          : 1614265335
Uptime (seconds)       : 9232
Heap Memory (MB)       : 567.72 / 1024.00
Off Heap Memory (MB)   : 0.00
Data Center            : dc1
Rack                   : default
Exceptions             : 0
Key Cache              : entries 39, size 3.46 KiB, capacity 51 MiB, 199 hits, 240 requests, 0.829 recent hit rate, 14400 save period in seconds
Row Cache              : entries 0, size 0 bytes, capacity 0 bytes, 0 hits, 0 requests, NaN recent hit rate, 0 save period in seconds
Counter Cache          : entries 0, size 0 bytes, capacity 25 MiB, 0 hits, 0 requests, NaN recent hit rate, 7200 save period in seconds
Chunk Cache            : entries 6, size 384 KiB, capacity 224 MiB, 111 misses, 3472 requests, 0.968 recent hit rate, NaN microseconds miss latency
Percent Repaired       : 100.0%
Token                  : (invoke with -T/--tokens to see all 256 tokens)
For details on all nodetool commands, see The nodetool utility.
Configure port forwarding
In order to access Cassandra utilities outside of the K8s cluster, if you don’t have an Ingress setup as described in Configure Ingress, you’ll need to configure port forwarding.
Begin by getting a list of your K8ssandra K8s services and ports:
kubectl get services
Output:
NAME                                   TYPE        CLUSTER-IP     EXTERNAL-IP   PORT(S)                                                 AGE
cass-operator-metrics                  ClusterIP   10.80.3.92     <none>        8383/TCP,8686/TCP                                       24h
k8ssandra-dc1-all-pods-service         ClusterIP   None           <none>        9042/TCP,8080/TCP,9103/TCP                              24h
k8ssandra-dc1-service                  ClusterIP   None           <none>        9042/TCP,9142/TCP,8080/TCP,9103/TCP,9160/TCP            24h
k8ssandra-dc1-stargate-service         ClusterIP   10.80.13.197   <none>        8080/TCP,8081/TCP,8082/TCP,8084/TCP,8085/TCP,9042/TCP   24h
k8ssandra-grafana                      ClusterIP   10.80.7.168    <none>        80/TCP                                                  24h
k8ssandra-kube-prometheus-operator     ClusterIP   10.80.8.109    <none>        443/TCP                                                 24h
k8ssandra-kube-prometheus-prometheus   ClusterIP   10.80.2.44     <none>        9090/TCP                                                24h
k8ssandra-reaper-reaper-service        ClusterIP   10.80.5.77     <none>        8080/TCP                                                24h
k8ssandra-seed-service                 ClusterIP   None           <none>        <none>                                                  24h
kubernetes                             ClusterIP   10.80.0.1      <none>        443/TCP                                                 27h
prometheus-operated                    ClusterIP   None           <none>        9090/TCP                                                24h
In the output above, the services of interest are:
- k8ssandra-grafana: The K8ssandra grafana service where the name is a combination of the K8ssandra cluster name you specified during the Helm install,
k8ssandra, and the postfix,-grafana. This service listens on the internal K8s port80. - prometheus-operated: The K8ssandra Prometheus daemon. This service listens on the internal K8s port
9090. - k8ssandra-reaper-reaper-service: The K8ssandra Reaper service where the name is a combination of the K8ssandra cluster name you specified during the Helm install,
k8ssandra,-reaper, the K8ssandra cluster name again, and the postfix-reaper-service. This port listens on the internal K8s port8080.
To configure port forwarding:
-
Open a new terminal.
-
Run the following 3
kubectl port-forwardcommands in the background:kubectl port-forward svc/k8ssandra-grafana 9191:80 & kubectl port-forward svc/prometheus-operated 9292:9090 & kubectl port-forward svc/k8ssandra-reaper-reaper-service 9393:8080 &Output:
[1] 29211
[2] 29212
[3] 29213

~/
Forwarding from 127.0.0.1:9292 -> 9090
Forwarding from [::1]:9292 -> 9090
Forwarding from 127.0.0.1:9393 -> 8080
Forwarding from [::1]:9393 -> 8080
Forwarding from 127.0.0.1:9191 -> 3000
Forwarding from [::1]:9191 -> 3000
The K8ssandra services are now available at:
- Prometheus: http://127.0.0.1:9292
- Grafana: http://127.0.0.1:9191
- Reaper: http://127.0.0.1:9393/webui
Terminate port forwarding
To terminate a particular forwarded port:
-
Get the process ID:
jobs -lOutput:
[3] + 29213 running kubectl port-forward svc/k8ssandra-reaper-k8ssandra-reaper-service 9393:8080 -
Kill the process
kill 80940Output:
[3] + terminated kubectl port-forward svc/k8ssandra-reaper-k8ssandra-reaper-service 9393:8080
Tip
Exiting the terminal instance will terminate all port forwarding services.Access K8ssandra monitoring utilities
K8ssandra deploys the following customized monitoring utilities:
- Prometheus a standard metrics collection and alerting tool.
- Grafana a set of preconfigured dashboards displaying important K8ssandra metrics.
Prometheus
To check on the health of your K8ssandra cluster using the K8ssandra Prometheus interface:
-
Access the Prometheus home page at http://127.0.0.1:9292:
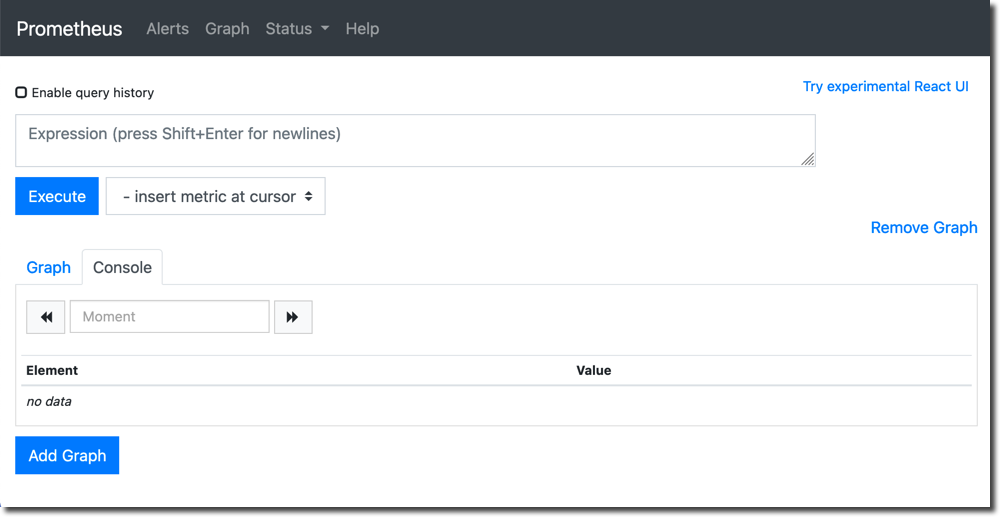
-
From the Status menu, choose Targets.
-
Verify that the
stargate/0andk8ssandra/0are in the stateUP: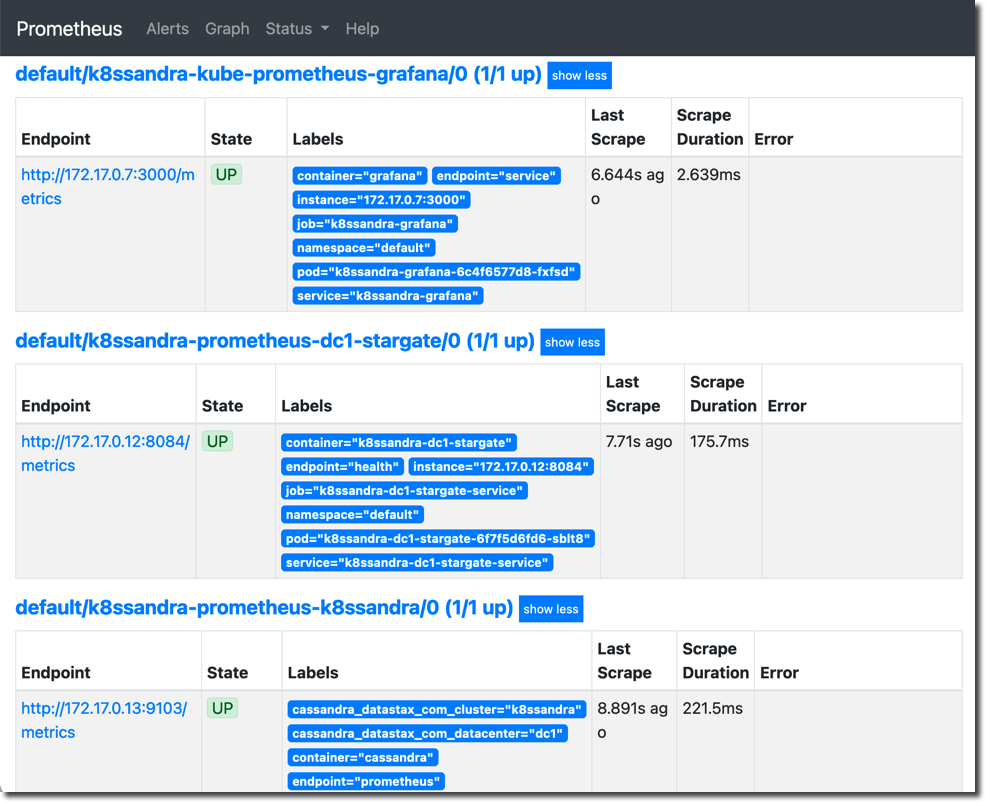
For more details on Prometheus, see the Prometheus web site.
Grafana
To monitor the health and performance of your K8ssandra cluster using the pre-configured K8ssandra dashboards:
-
Retrieve the Grafana login username using the
helm showcommand:helm show values k8ssandra/k8ssandra | grep "adminUser"Output:
admin -
Retrieve the Grafana login password using the
helm showcommand:helm show values k8ssandra/k8ssandra | grep "adminPassword"Output:
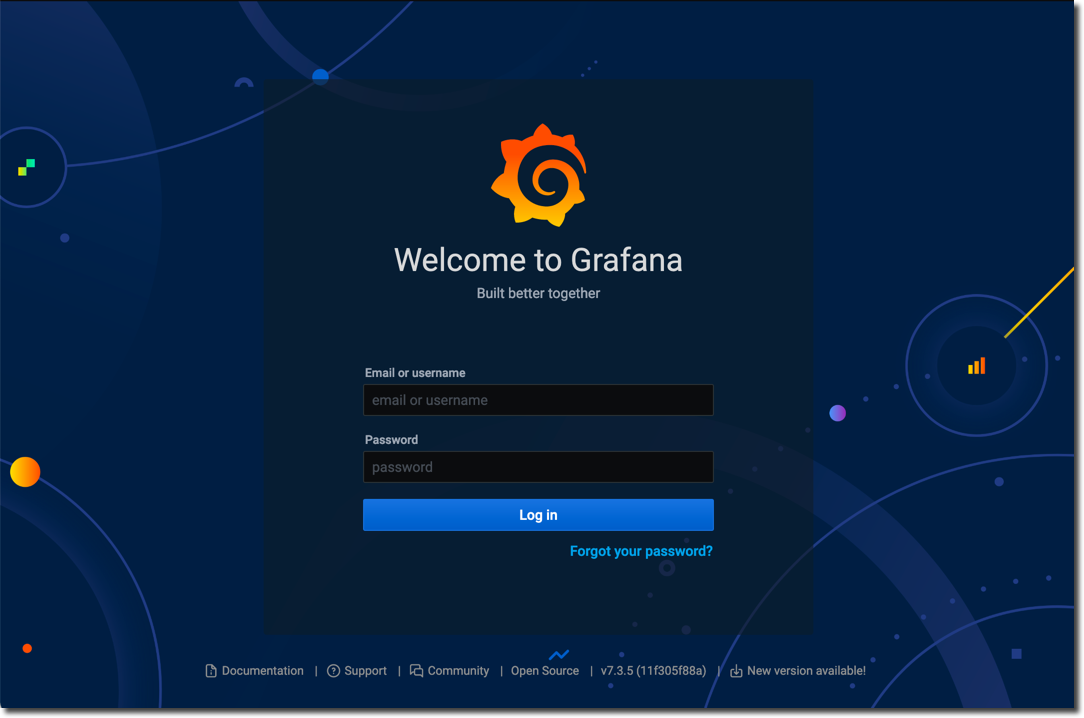
secret -
Access the Grafana login screen at http://127.0.0.1:9191 and login using the username and password:
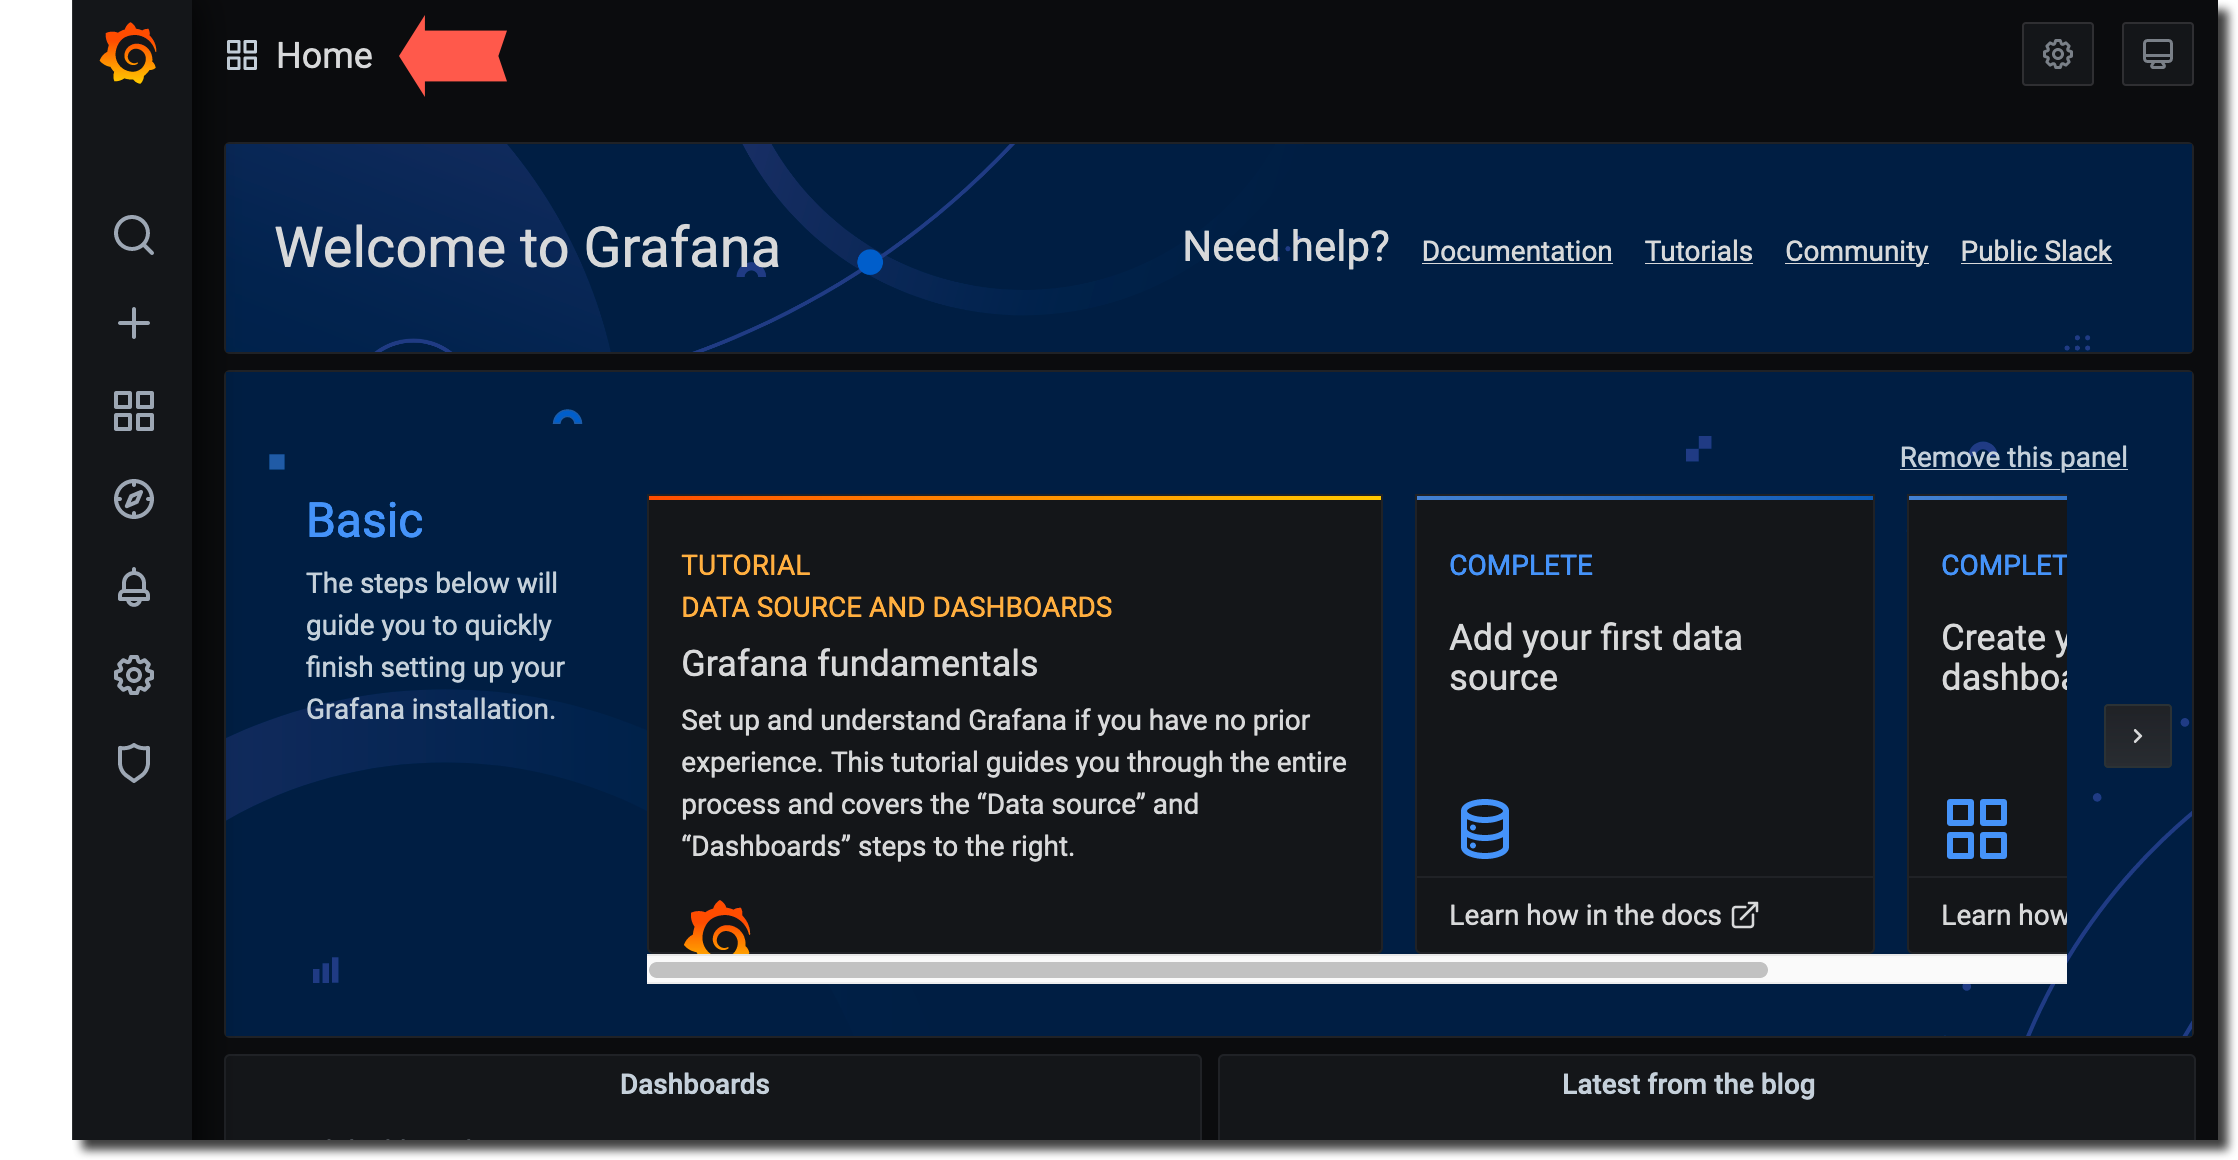
-
Click the home button indicated by the arrow:
-
Click the
K8ssandra Overviewdashboard: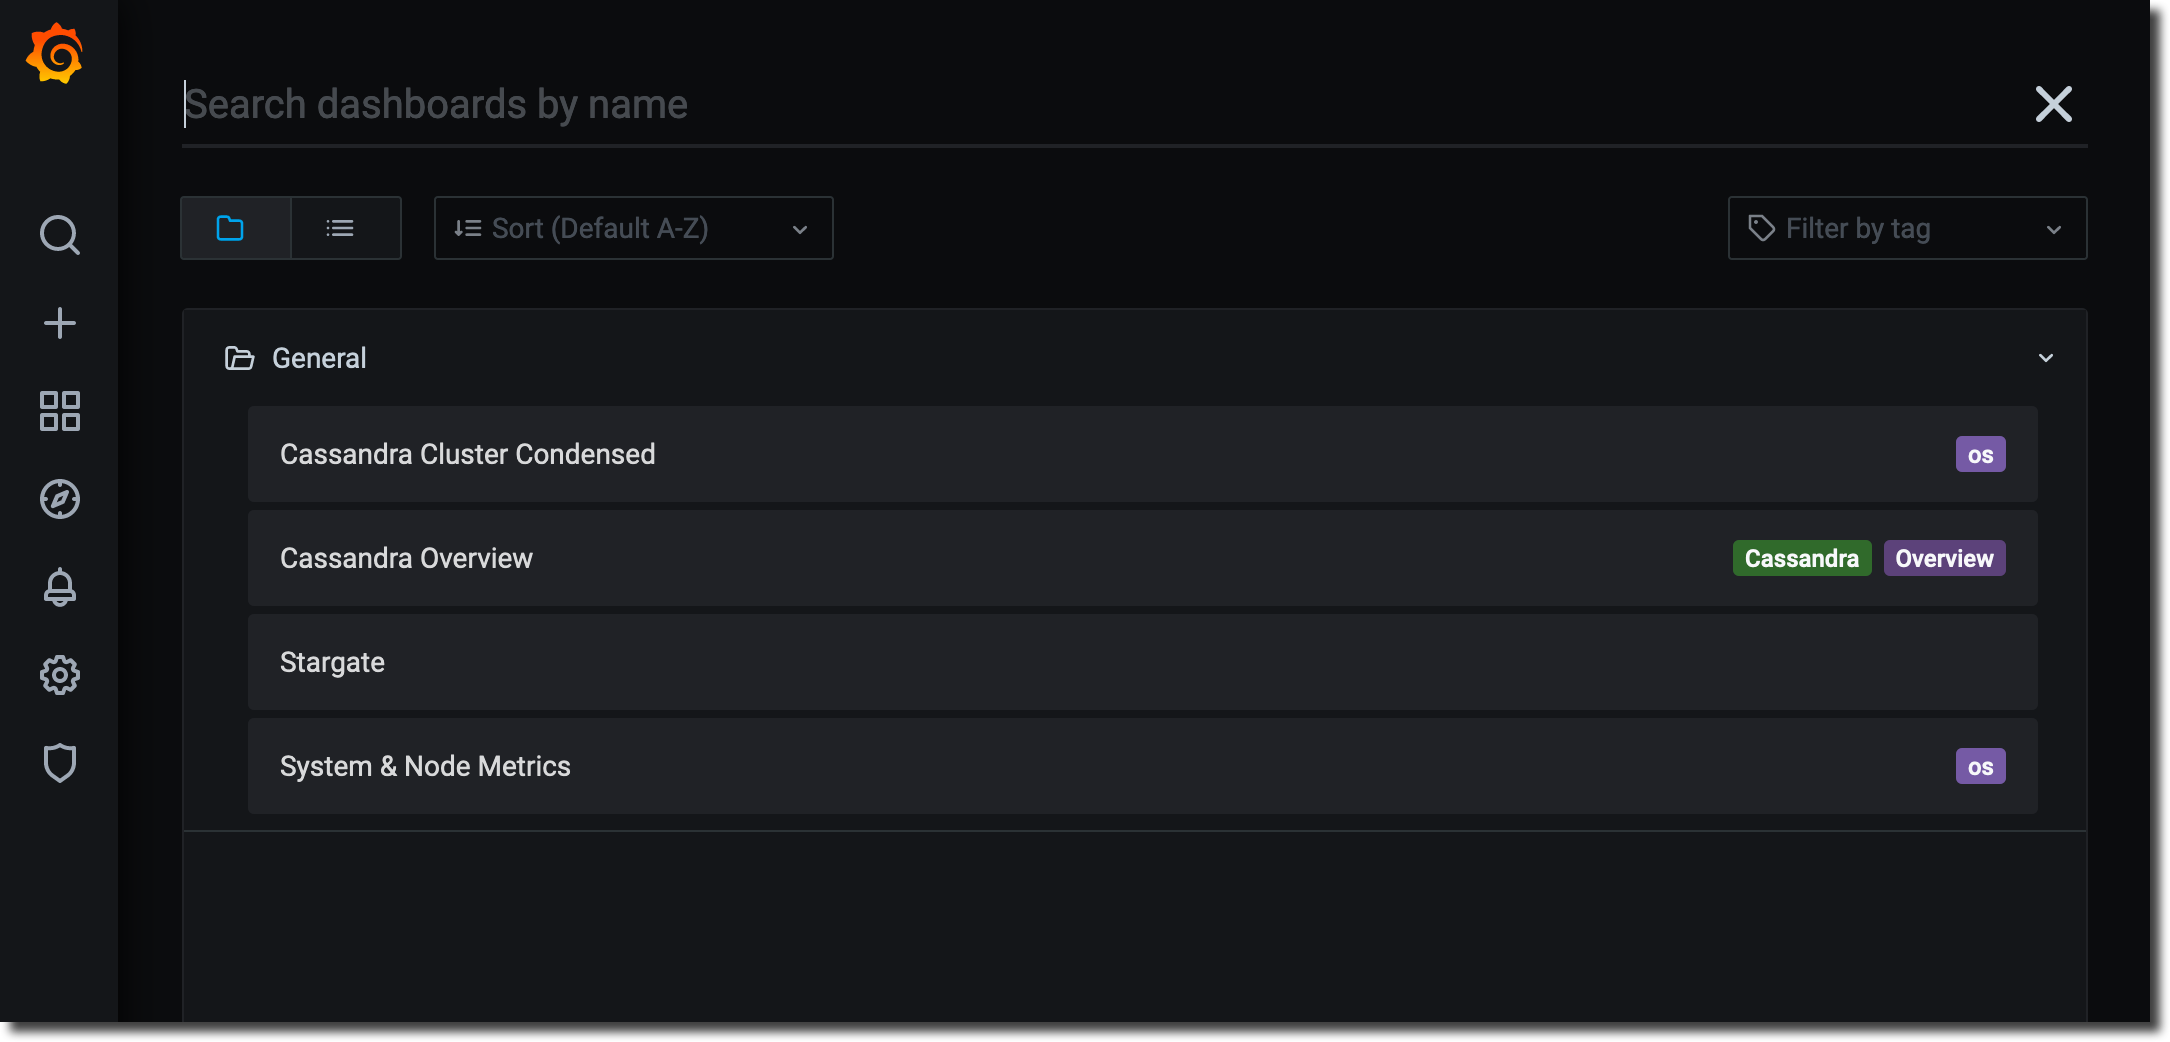
-
The
K8ssandra Overviewdashboard is displayed: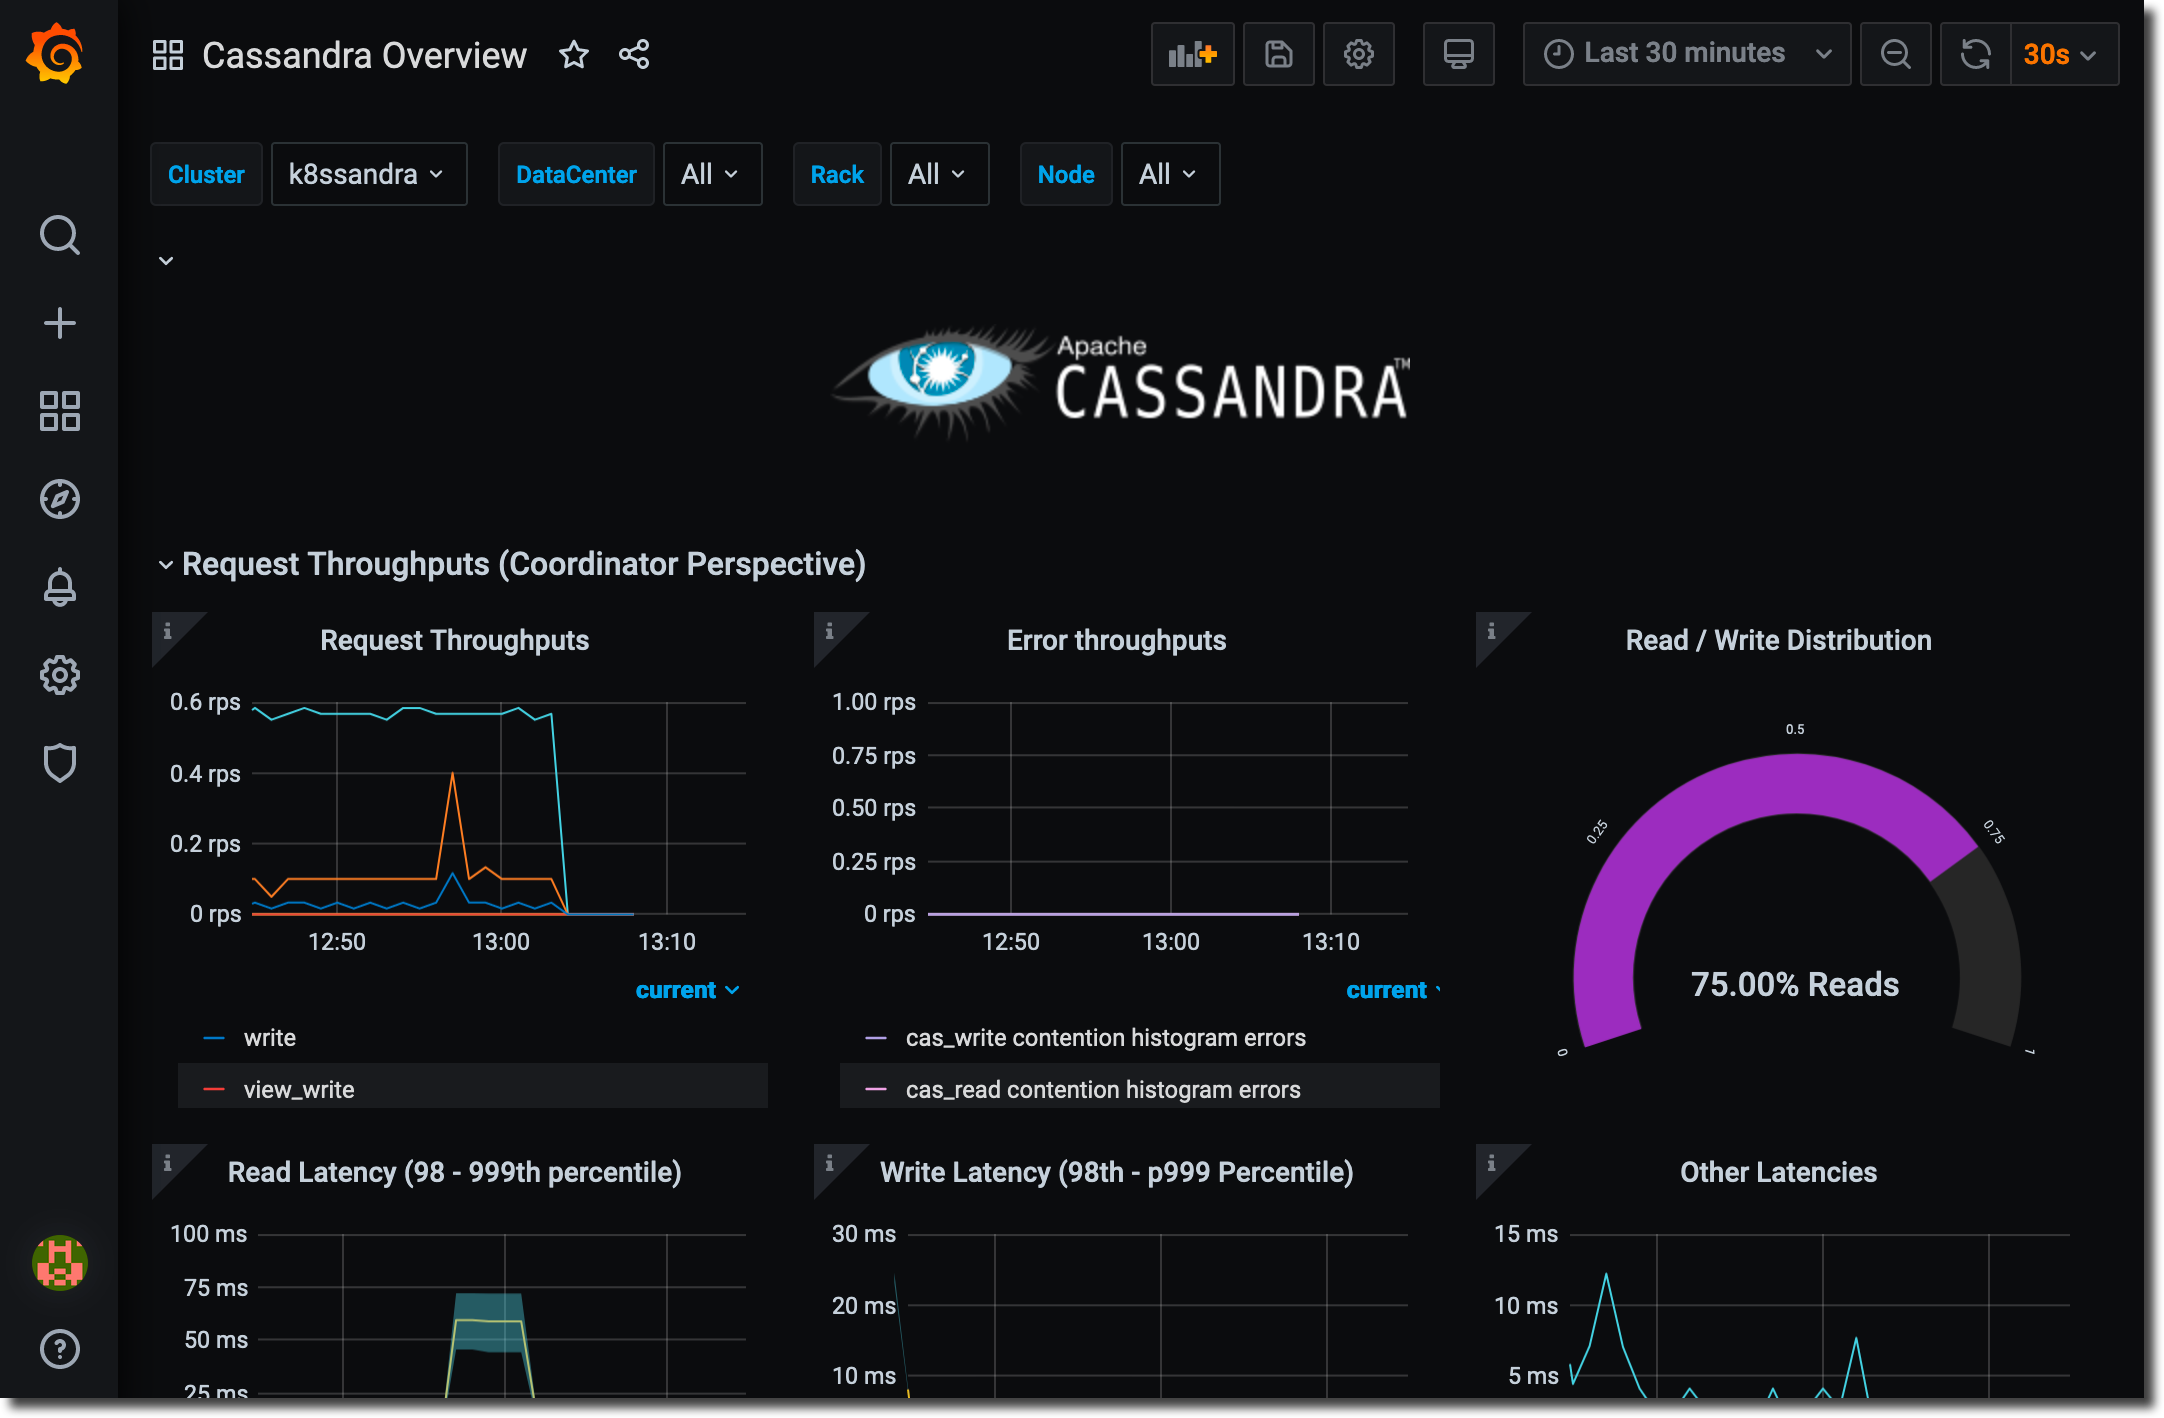
-
Explore the other K8ssandra dashboards.
For more information see the Grafana web site.
Access Reaper
Reaper is an easy interface for managing K8ssandra cluster repairs. Reaper is deployed as part of the K8ssandra install.
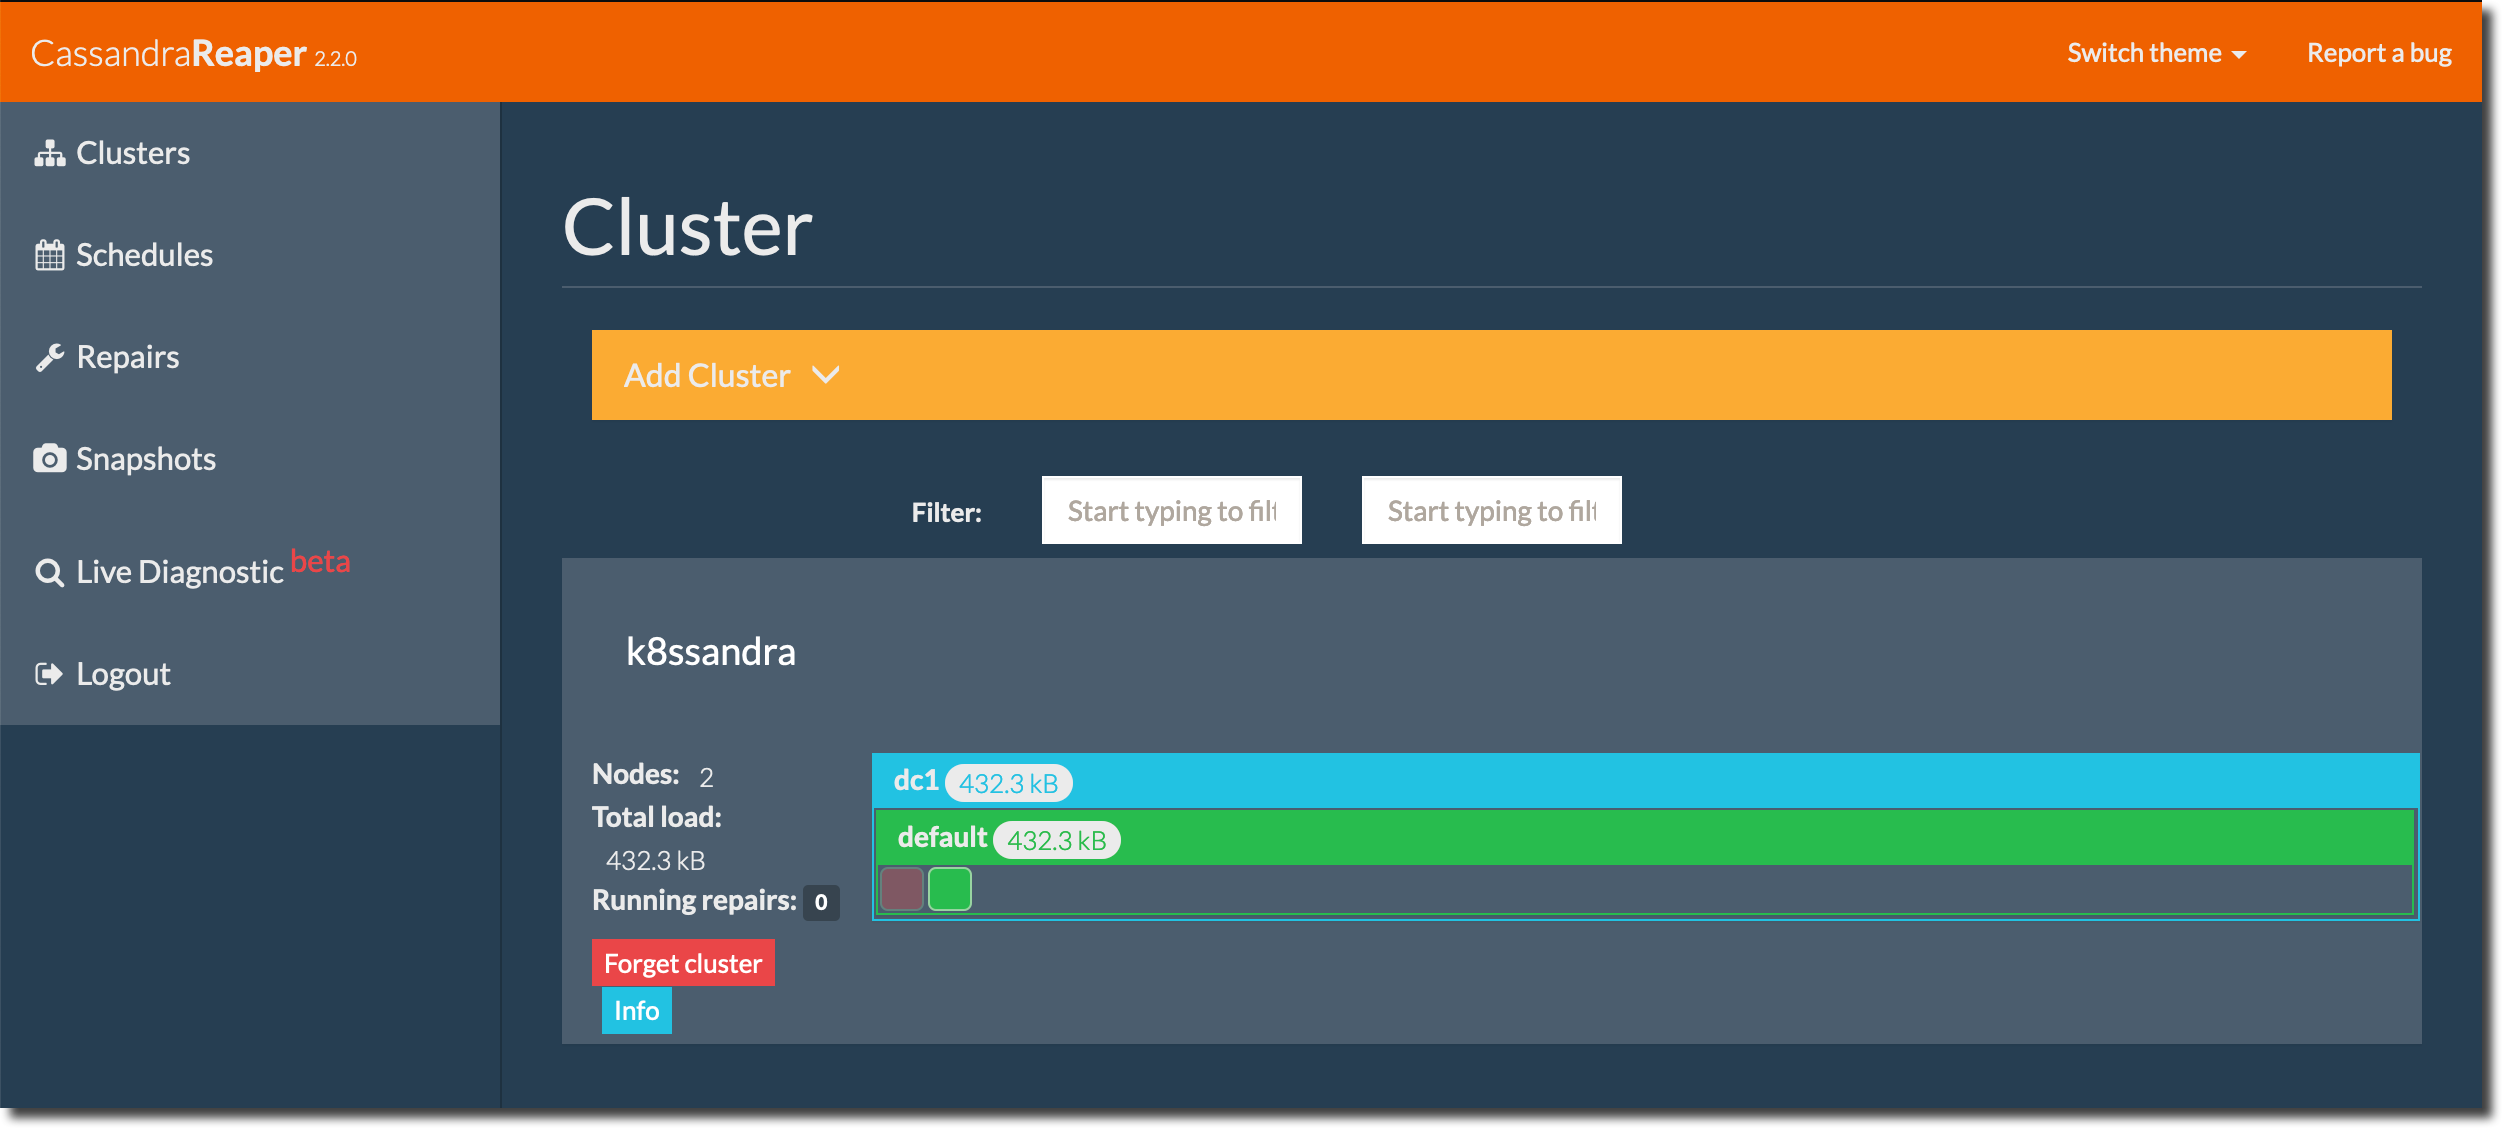
For details, start in the Reaper topic. Then read about the repair tasks you can perform with Reaper.
Upgrade K8ssandra
You can easily upgrade your K8ssandra software with the helm repo update command, or apply new settings with the helm upgrade command.
For details, see Upgrade K8ssandra.
Next steps
- FAQs: If you’re new to K8ssandra, these FAQs are for you.
- Components: Dig in to each deployed component of the K8ssandra stack and see how it communicates with the others.
- Tasks: Need to get something done? Check out the Tasks topics for a helpful collection of outcome-based solutions.
- Reference: Explore the K8ssandra configuration interface (Helm charts), the available options, and a Glossary.
We encourage SREs to actively participate in the K8ssandra community.
Feedback
Was this page helpful?
Glad to hear it! Please tell us how we can improve.
Sorry to hear that. Please tell us how we can improve.