Monitor Cassandra
When you used Helm to install a k8ssandra instance in Kubernetes, one of the key features provided was a set of preconfigured Grafana dashboards. They visualize data collected about your environment by the Prometheus Operator, which is also packaged with K8ssandra. Use the Grafana dashboards to monitor your K8ssandra cluster’s health and traffic metrics.
After you’ve met the prerequisites identified below, access the preconfigured Grafana dashboards. For example:
http://grafana.localhost:8080/
Tools
- Web browser
Prerequisites
- Kubernetes cluster with the following elements deployed:
- DNS name for the Grafana service
- DNS name for the Prometheus service
Tip
As an alternative to configuring an Ingress, consider port forwarding. It’s another way to provide external access to resources that have been deployed by K8ssandra in your Kubernetes environment. Those resources could include Prometheus metrics, pre-configured Grafana dashboards, and the Reaper web interface for repairs of Cassandra® data. The kubectl port-forward command does not require an Ingress/Traefik to work.
- Developers, see Set up port forwarding.
- Site reliability engineers, see Configure port forwarding.
Access Grafana Interface
If you haven’t already, upgrade an existing k8ssandra by enabling the Traefik Ingress and passing in Prometheus and Grafana host flags.
Command-line examples when the host is local, and k8ssandra is the cluster-name:
helm upgrade k8ssandra k8ssandra/k8ssandra --set prometheus.ingress.enabled=true,prometheus.ingress.host=localhost
helm upgrade k8ssandra k8ssandra/k8ssandra --set grafana.ingress.enabled=true,grafana.ingress.host=localhost
To check the installed or upgraded pods' ready status, without having to submit multiple kubectl get pods commands, use kubectl rollout status. The command waits up to ten minutes (timeout is configurable) and gives a line of output as one or more pods in the set become ready. The format to check a statefulset (sts) is:
kubectl rollout status statefulset ${CLUSTERNAME}-${DATACENTER}-default-sts
An example where the CLUSTERNAME from the prior helm install or helm upgrade was k8ssandra:
kubectl rollout status statefulset k8ssandra-dc1-default-sts
Output:
Waiting for 1 pods to be ready...
Waiting for 1 pods to be ready...
partitioned roll out complete: 1 new pods have been updated...
If you submit the command above too quickly after the helm install or helm upgrade you may get an error that no statefulset with that name exists; in which case, you can run the kubectl rollout status command again.
You should also check the stargate pod status before proceeding. Example:
kubectl rollout status deployment k8ssandra-dc1-stargate
Output:
Waiting for 1 pods to be ready...
Waiting for 1 pods to be ready...
Waiting for 1 pods to be ready...
partitioned roll out complete: 1 new pods have been updated...
Then check the overall status of the deployed pods.
kubectl get pods
Output:
NAME                                                READY   STATUS      RESTARTS   AGE
k8ssandra-cass-operator-766849b497-klgwf            1/1     Running     0          7m33s
k8ssandra-dc1-default-sts-0                         2/2     Running     0          7m5s
k8ssandra-dc1-stargate-5c46975f66-pxl84             1/1     Running     0          7m32s
k8ssandra-grafana-679b4bbd74-wj769                  2/2     Running     0          7m32s
k8ssandra-kube-prometheus-operator-85695ffb-ft8f8   1/1     Running     0          7m32s
k8ssandra-reaper-655fc7dfc6-n9svw                   1/1     Running     0          4m52s
k8ssandra-reaper-operator-79fd5b4655-748rv          1/1     Running     0          7m33s
k8ssandra-reaper-schema-dxvmm                       0/1     Completed   0          5m3s
prometheus-k8ssandra-kube-prometheus-prometheus-0   2/2     Running     1          7m27s
Notice that Grafana is running, as well as other services such as Prometheus.
If you are in a local Kubernetes environment, you can now access the Grafana dashboard with a URL such as:
Grafana credentials
The default configured credentials for Grafana are:
grafana:
  adminUser: admin
  adminPassword: secret
Refer to: https://github.com/k8ssandra/k8ssandra/blob/main/charts/k8ssandra/values.yaml
You can change the credentials in several ways:
-
In the Grafana admin UI. See: http://grafana.localhost:8080/profile/password
-
Or edit a copy of values.yaml; update the credentials; submit a
helm upgradecommand to the cluster. Example:helm upgrade cluster-name k8ssandra/k8ssandra -f my-values.yaml` -
Or pass in a
--set grafana.adminPasswordflag. Example:`helm upgrade cluster-name k8ssandra/k8ssandra --set grafana.adminPassword=NewpAssw0rd!`
Navigating in Grafana
From the Grafana start page, http://grafana.localhost:8080 in local installs, click the Dashboards icon shown below and select the Manage pane:
![]()
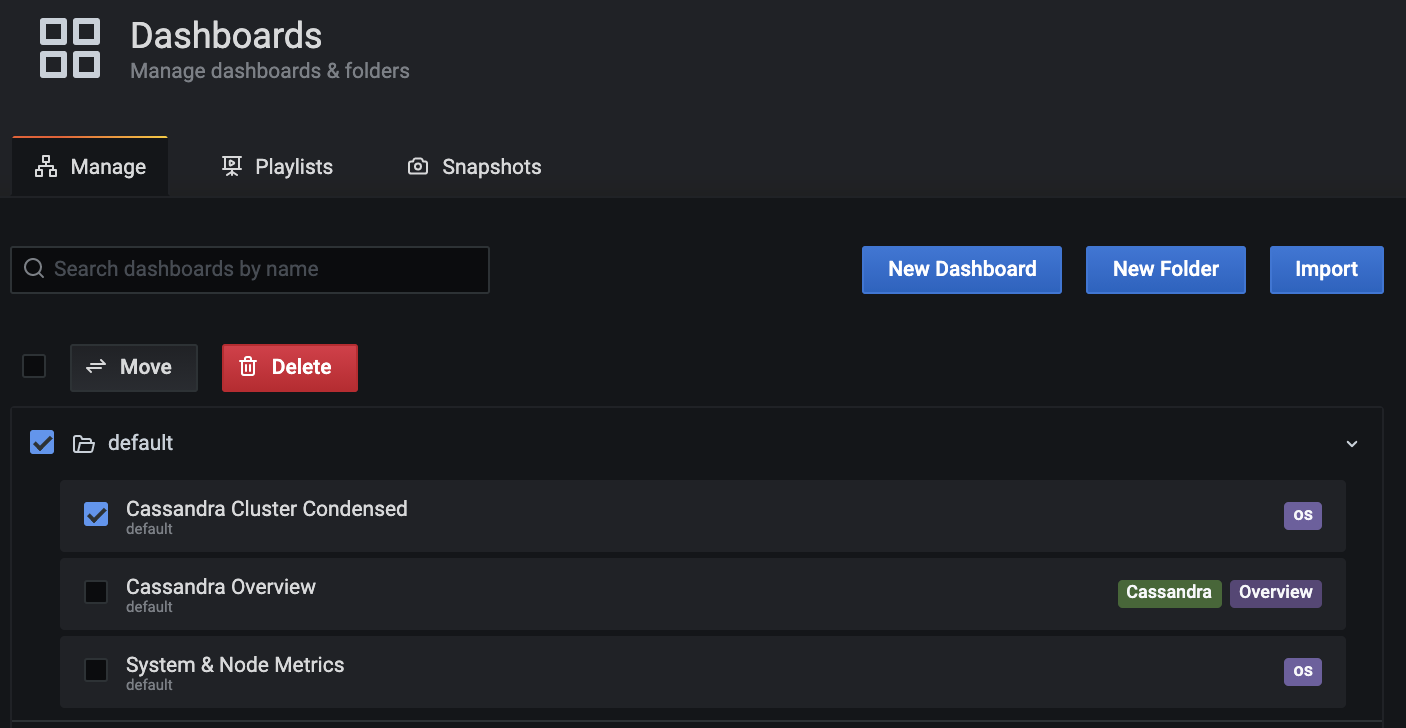
Grafana loads its dashboard options:
- Enable the Default checkbox.
- Click the checkbox for one of the dashboards that K8ssandra created when you installed the
k8ssandrainstance - To open the selected dashboard, click on its text link. In this example, you’d click on
Cassandra Cluster Condensed:
Here’s an example of the Cassandra Cluster Condensed dashboard in Grafana:
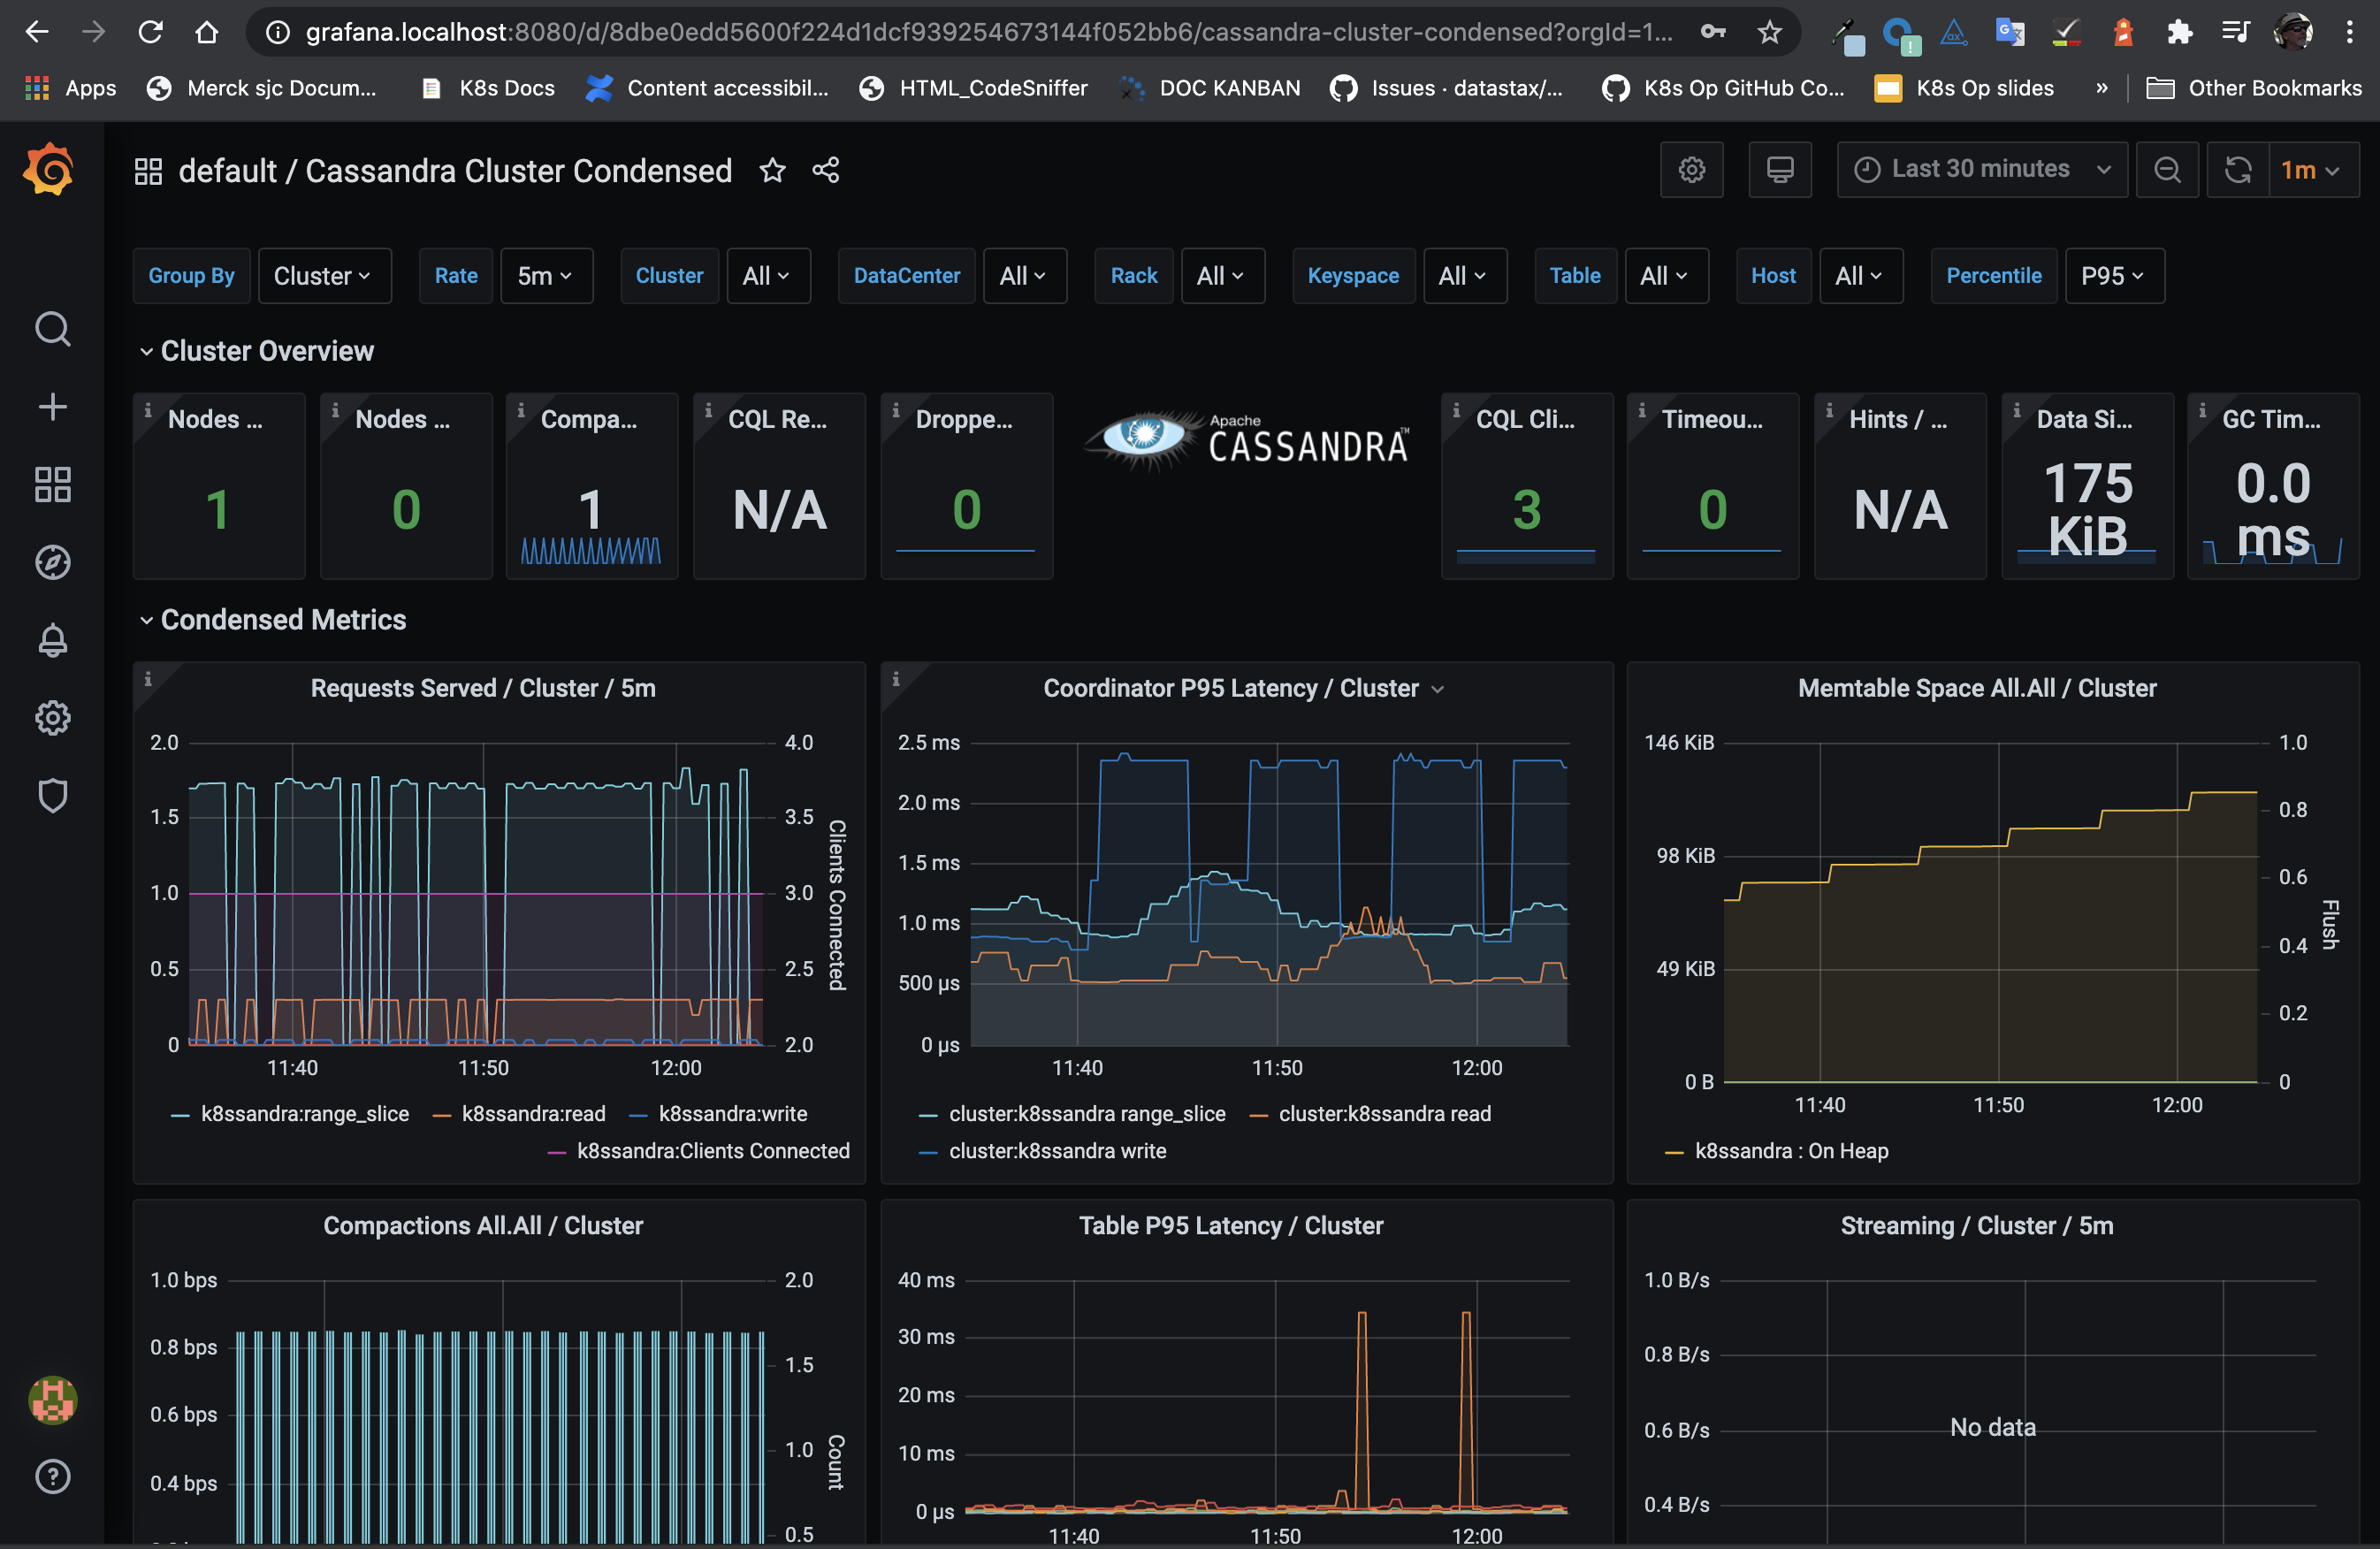
What can I do in Grafana?
- Cluster health
- Traffic metrics
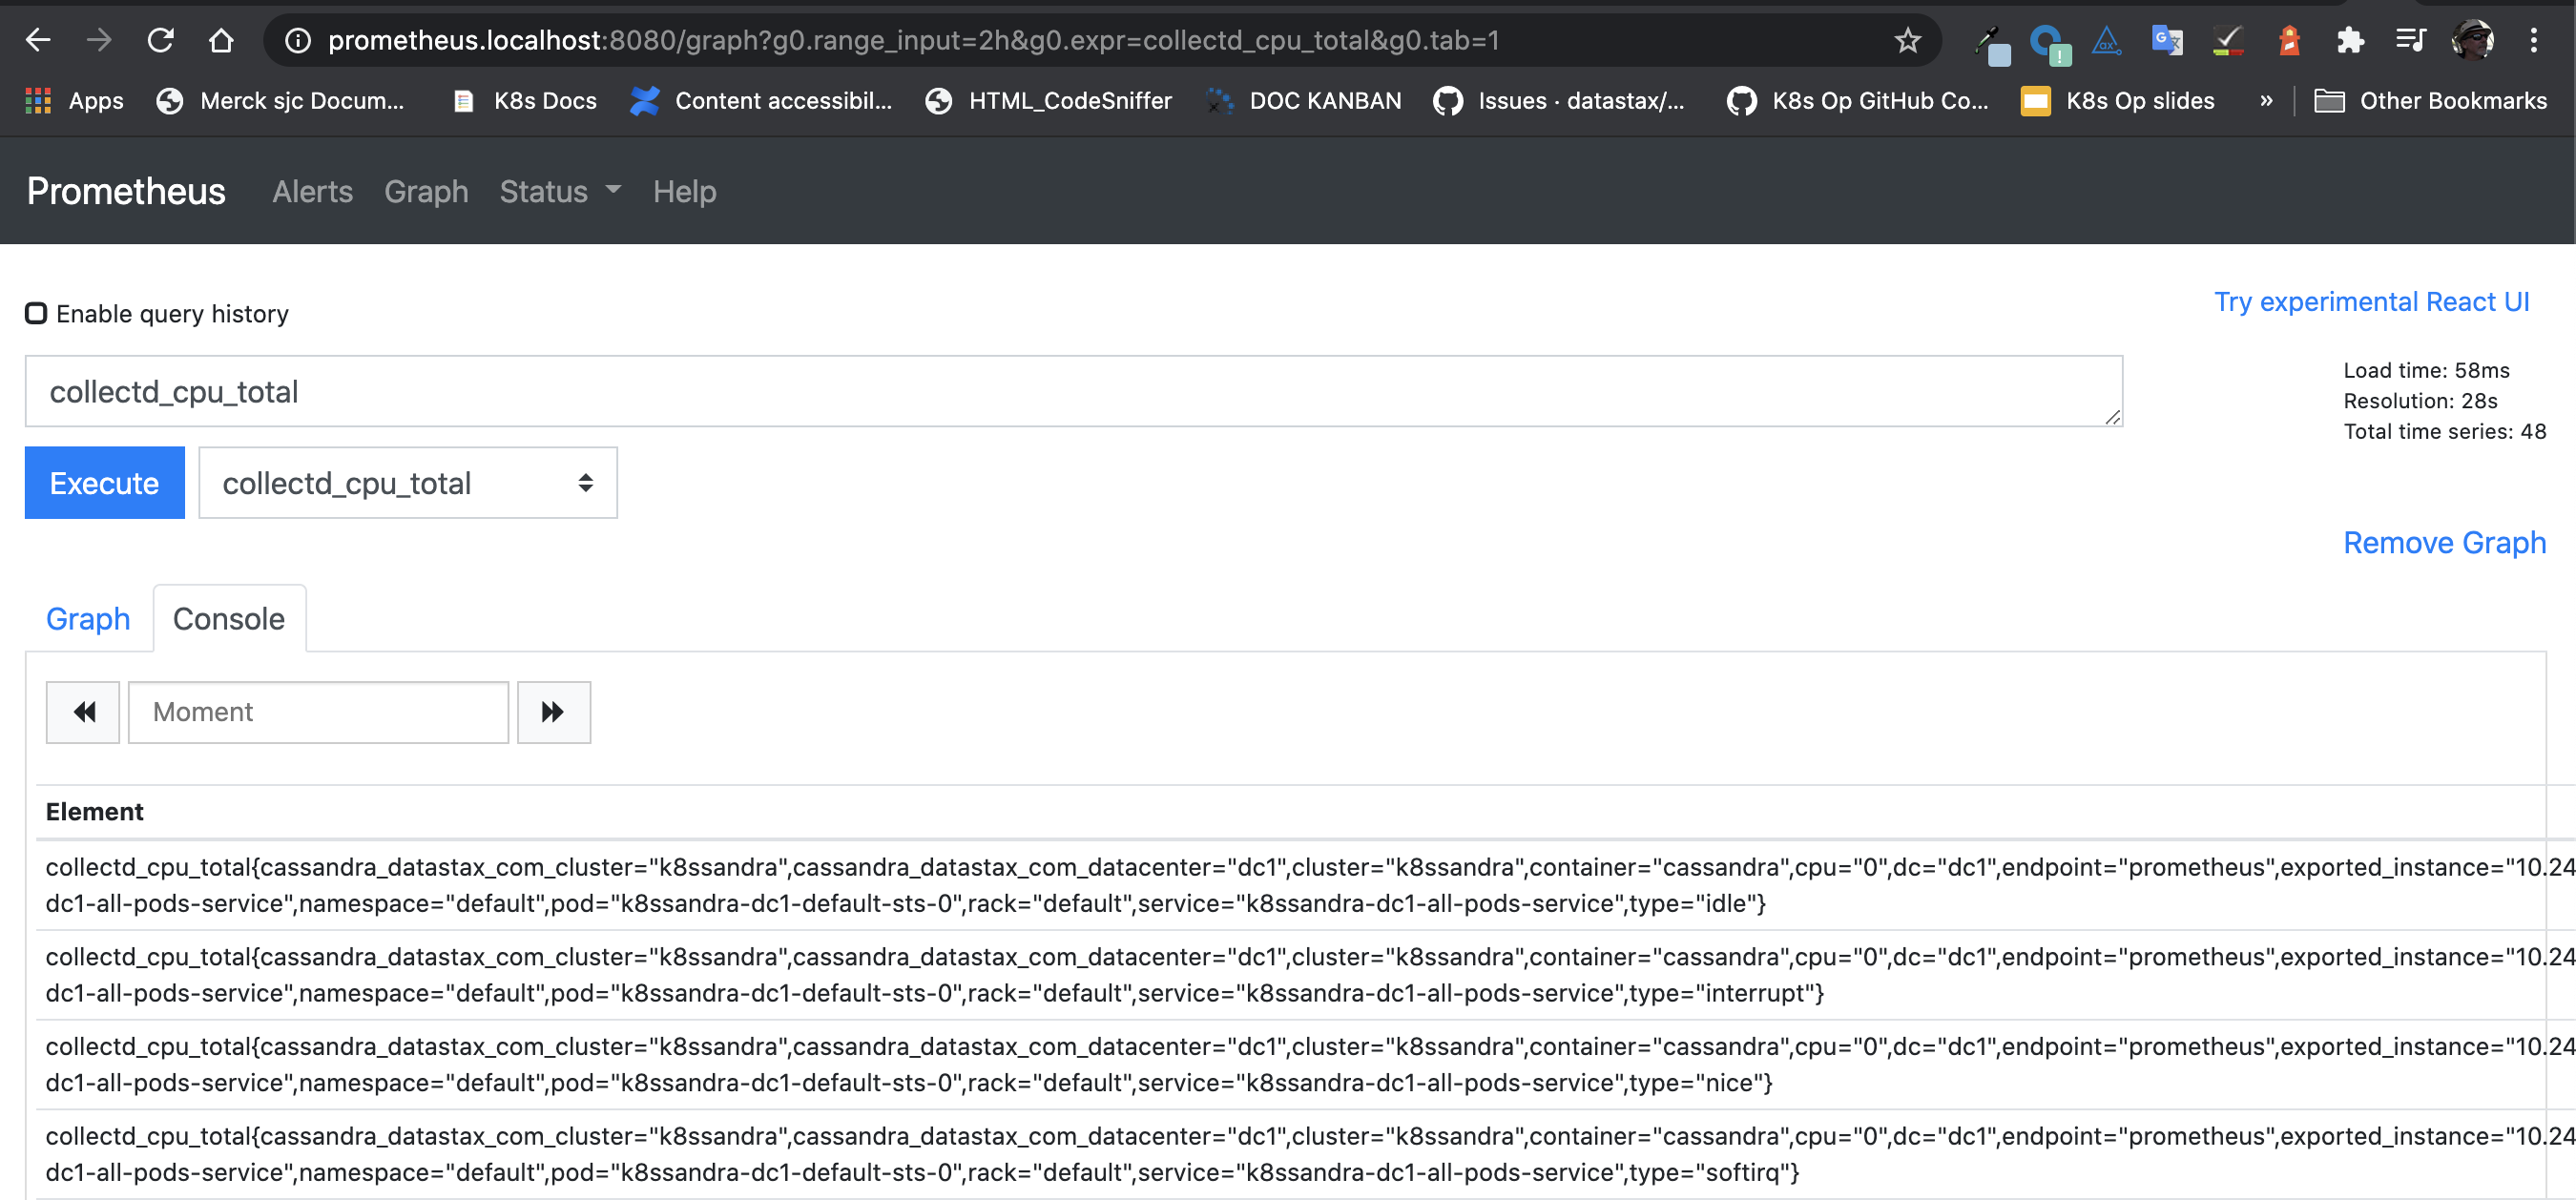
Access Prometheus Interface
Prometheus is available at the following address if running locally:
http://prometheus.localhost:8080
What can I do in Prometheus?
- Validate servers being scraped
- Confirm metrics collection
Next steps
Explore other K8ssandra tasks.
See the Reference topics for information about K8ssandra Helm charts, and a glossary.
Feedback
Was this page helpful?
Glad to hear it! Please tell us how we can improve.
Sorry to hear that. Please tell us how we can improve.