Access K8ssandra Monitoring with Traefik
Follow these steps to configure and install Traefik Ingress custom resources for accessing your K8ssandra cluster’s monitoring interface (provided by Grafana and Prometheus).
Tools
- Helm
Prerequisites
-
Kubernetes cluster with the following elements deployed:
See Configuring Kind for an example of how to set up a local installation.
-
DNS name for the Grafana service
-
DNS name for the Prometheus service
Note
If you do not have a DNS name available, consider using a service like xip.io to generate a domain name based on the ingress IP address. For local Kind clusters this may look likemonitoring.127.0.0.1.xip.io which would return the address 127.0.0.1 during DNS lookup.
Tip
As an alternative to configuring an Ingress, consider port forwarding. It’s another way to provide external access to resources that have been deployed by K8ssandra in your Kubernetes environment. Those resources could include Prometheus metrics, pre-configured Grafana dashboards, and the Reaper web interface for repairs of Cassandra® data. The kubectl port-forward command does not require an Ingress/Traefik to work.
- Developers, see Set up port forwarding.
- Site reliability engineers, see Configure port forwarding.
Helm Parameters
The k8ssandra Helm chart contains templates for the Traefik IngressRoute custom resource. These may be enabled at any time either through a values.yaml file or command-line flags.
For the latest, see the sample values.yaml.
Note the host parameters in the values.yaml is where the DNS names must be provided.
Enabling Traefik Ingress
Traefik ingress may be enabled on the command-line or via a values.yaml file. The K8ssandra team recommends storing this information in a values.yaml as that may be version controlled and managed in a DevOps friendly manner. Examples of both approaches are provided below as reference.
values.yaml
New install:
helm install cluster-name k8ssandra/k8ssandra -f traefik.values.yaml
Existing cluster:
helm upgrade cluster-name k8ssandra/k8ssandra -f traefik.values.yaml
Command-line
New install:
# New Install
helm install k8ssandra k8ssandra/k8ssandra --set prometheus.ingress.enabled=true,prometheus.ingress.host=localhost
helm install k8ssandra k8ssandra/k8ssandra --set grafana.ingress.enabled=true,grafana.ingress.host=localhost
Existing cluster:
helm upgrade k8ssandra k8ssandra/k8ssandra --set prometheus.ingress.enabled=true,prometheus.ingress.host=localhost
helm upgrade k8ssandra k8ssandra/k8ssandra --set grafana.ingress.enabled=true,grafana.ingress.host=localhost
Validate Traefik Configuration
Note
This step is optional. The next step will also prove that the configuration is working.With the ingress routes configured and deployed to Kubernetes, we can access the Traefik dashboard to validate the configuration has been picked up and is detecting the appropriate services.
-
Open your web browser and point it at the Traefik dashboard. This may require
kubectl port-forwardor the steps in our Configuring Kind guide.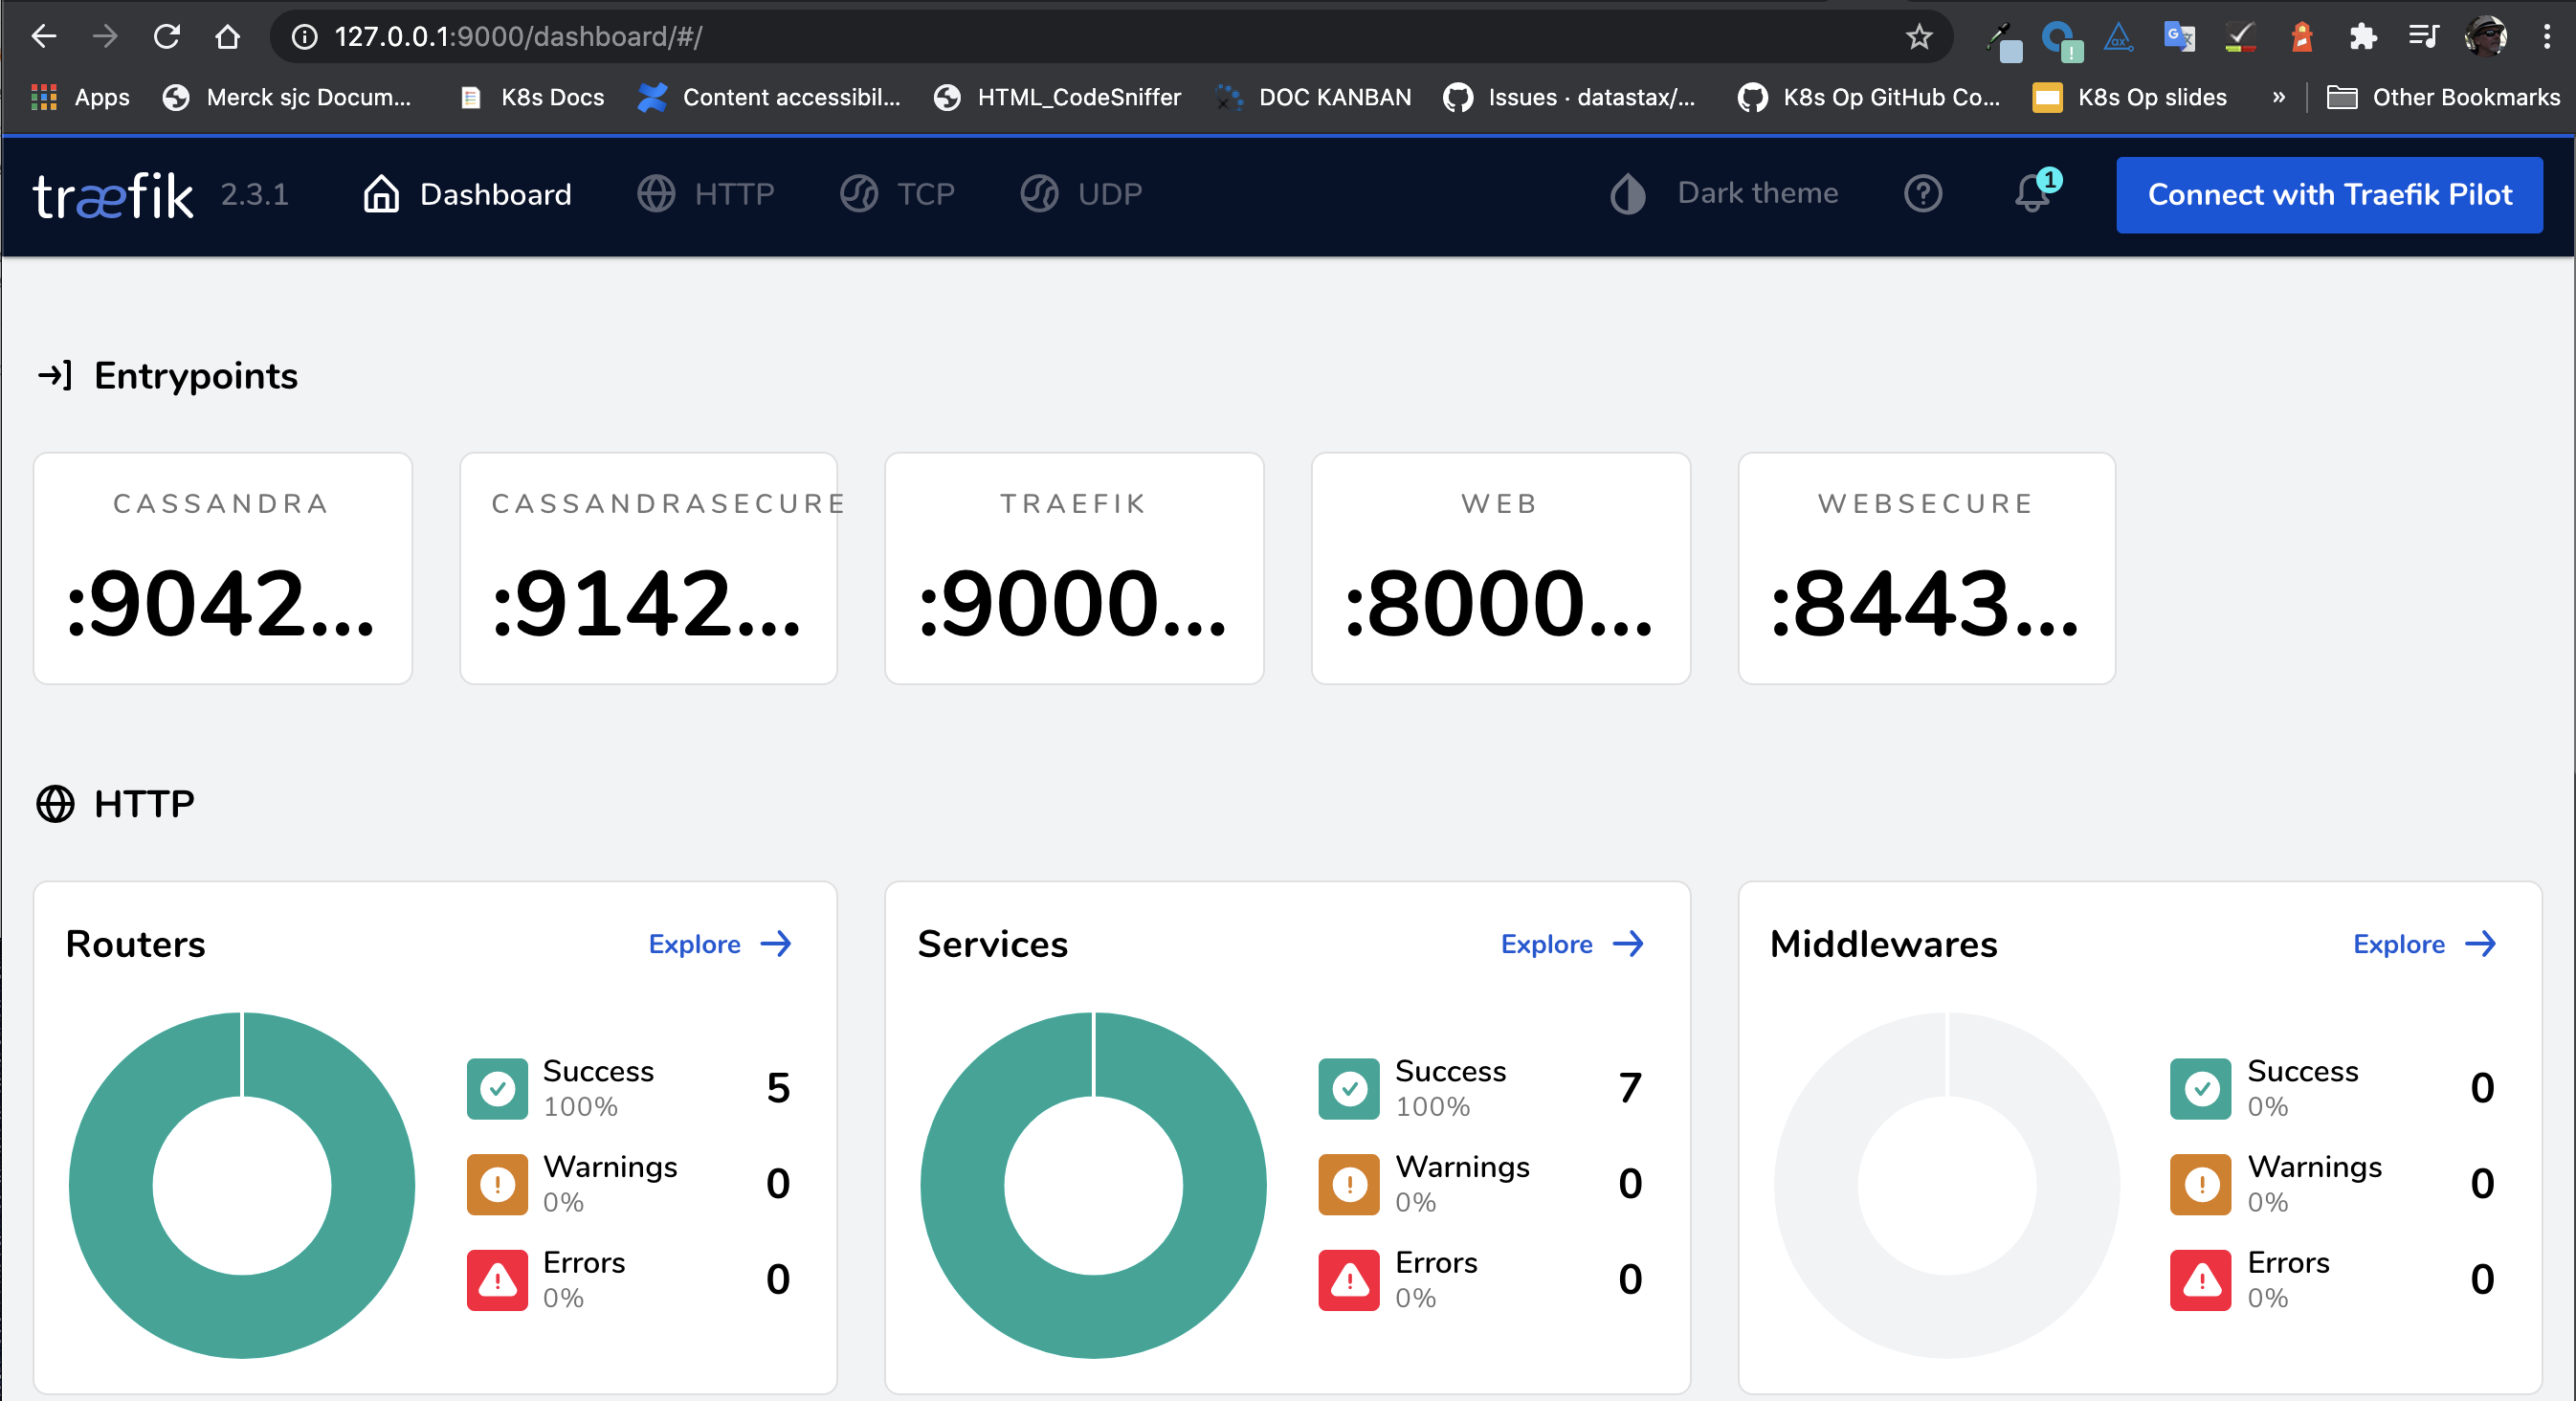
-
Navigate to the HTTP Routers page
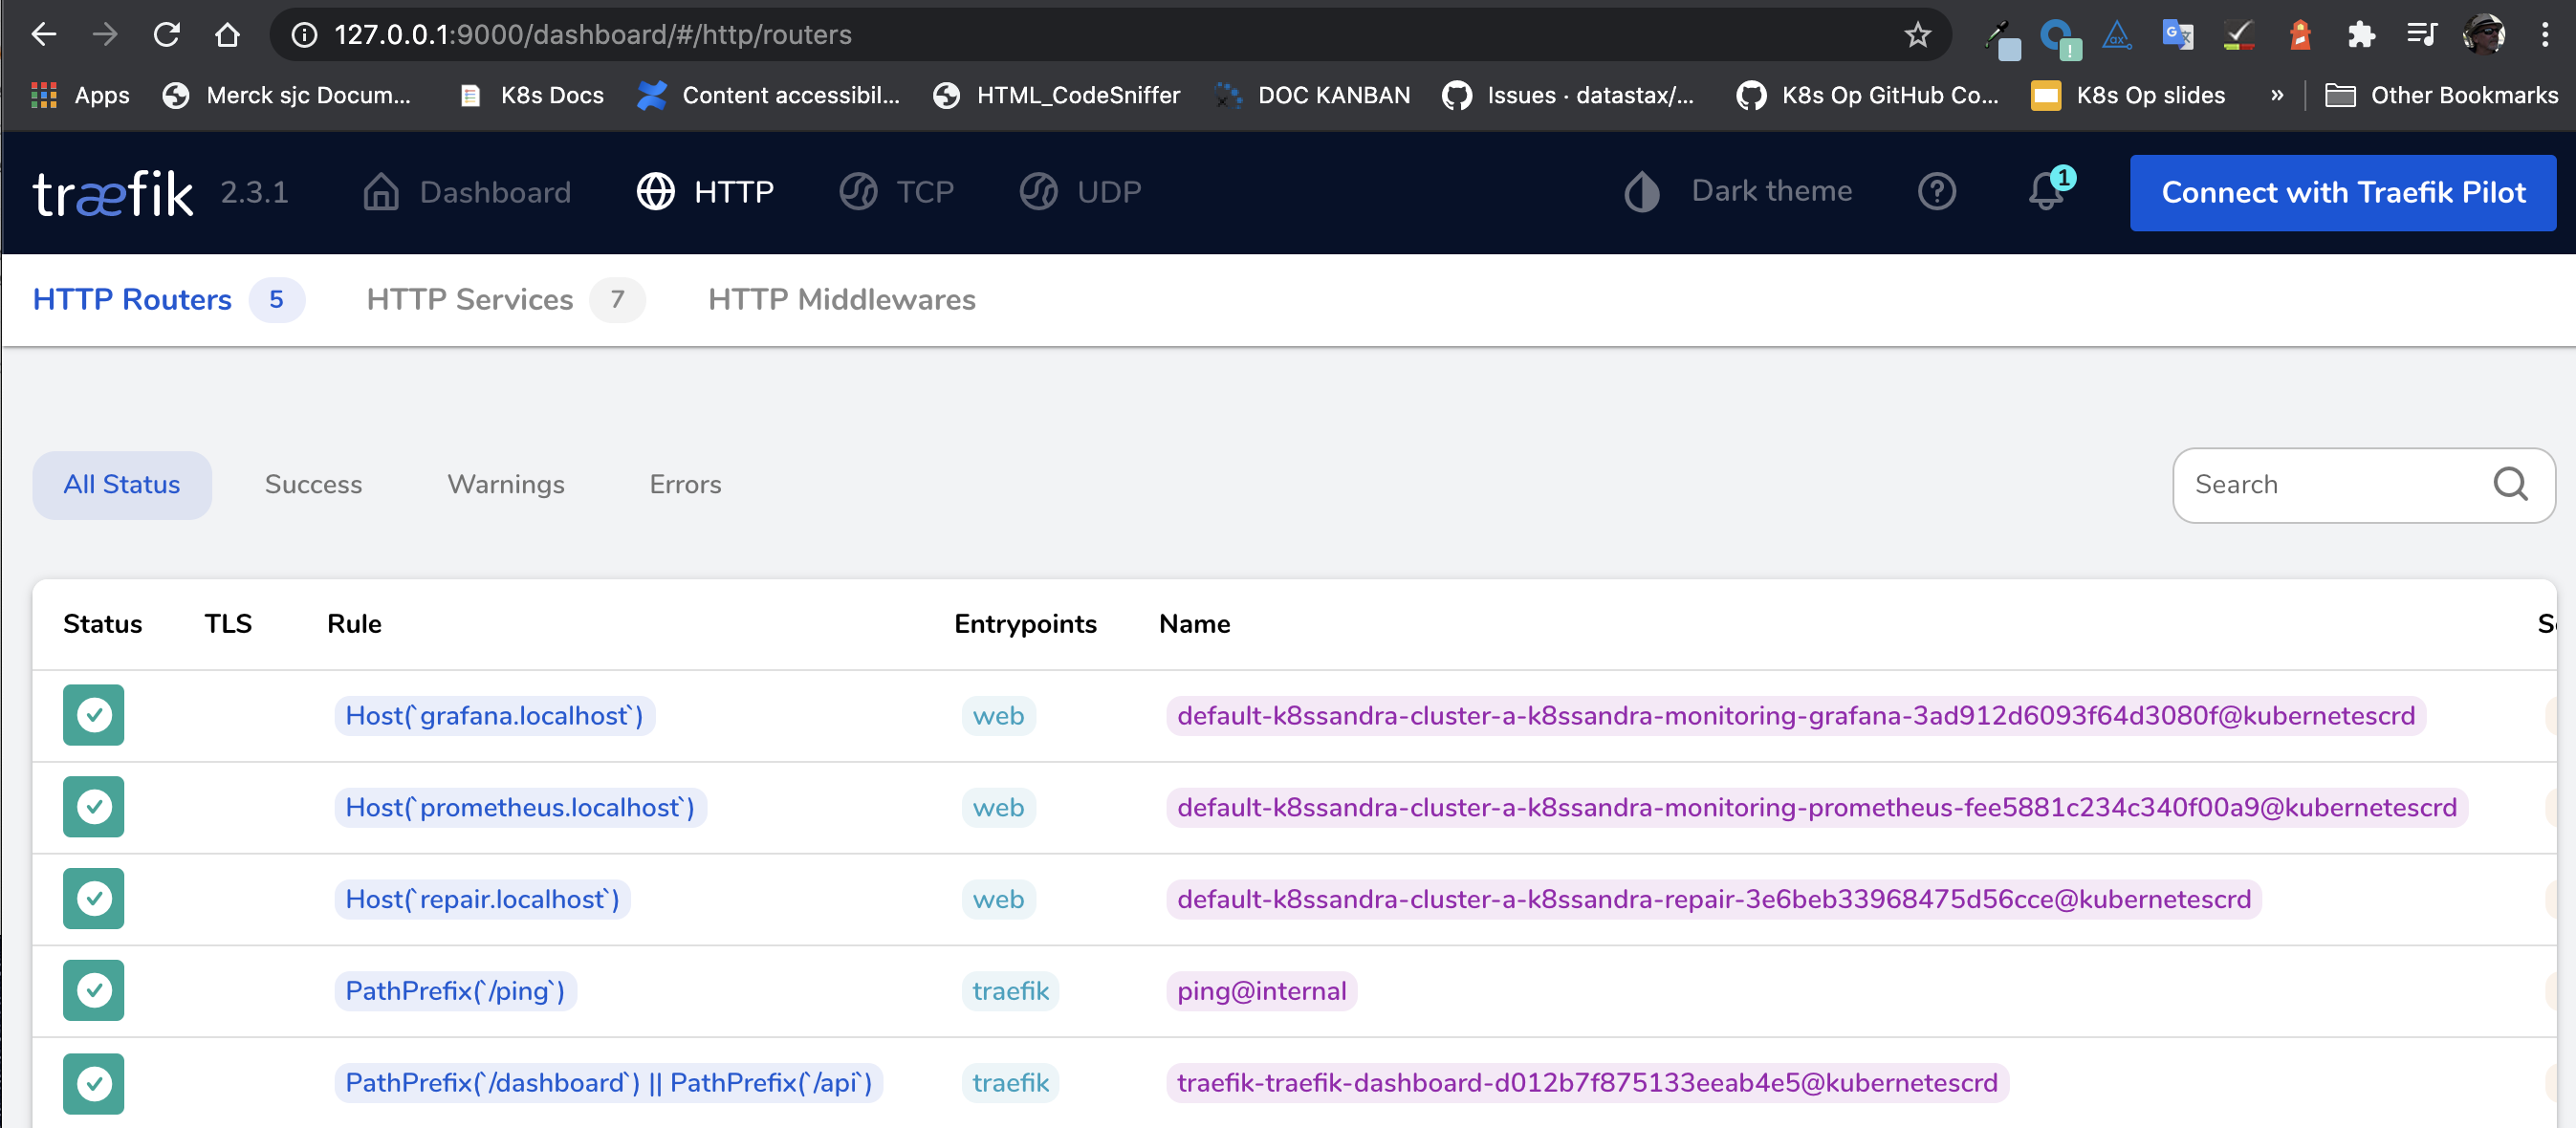
There should be entries representing the hostname based rules created as part of the Helm command. Note the Kubernetes logo to the right of the table indicating it was provisioned via a Kubernetes custom resource.
-
Navigate to the HTTP Services page
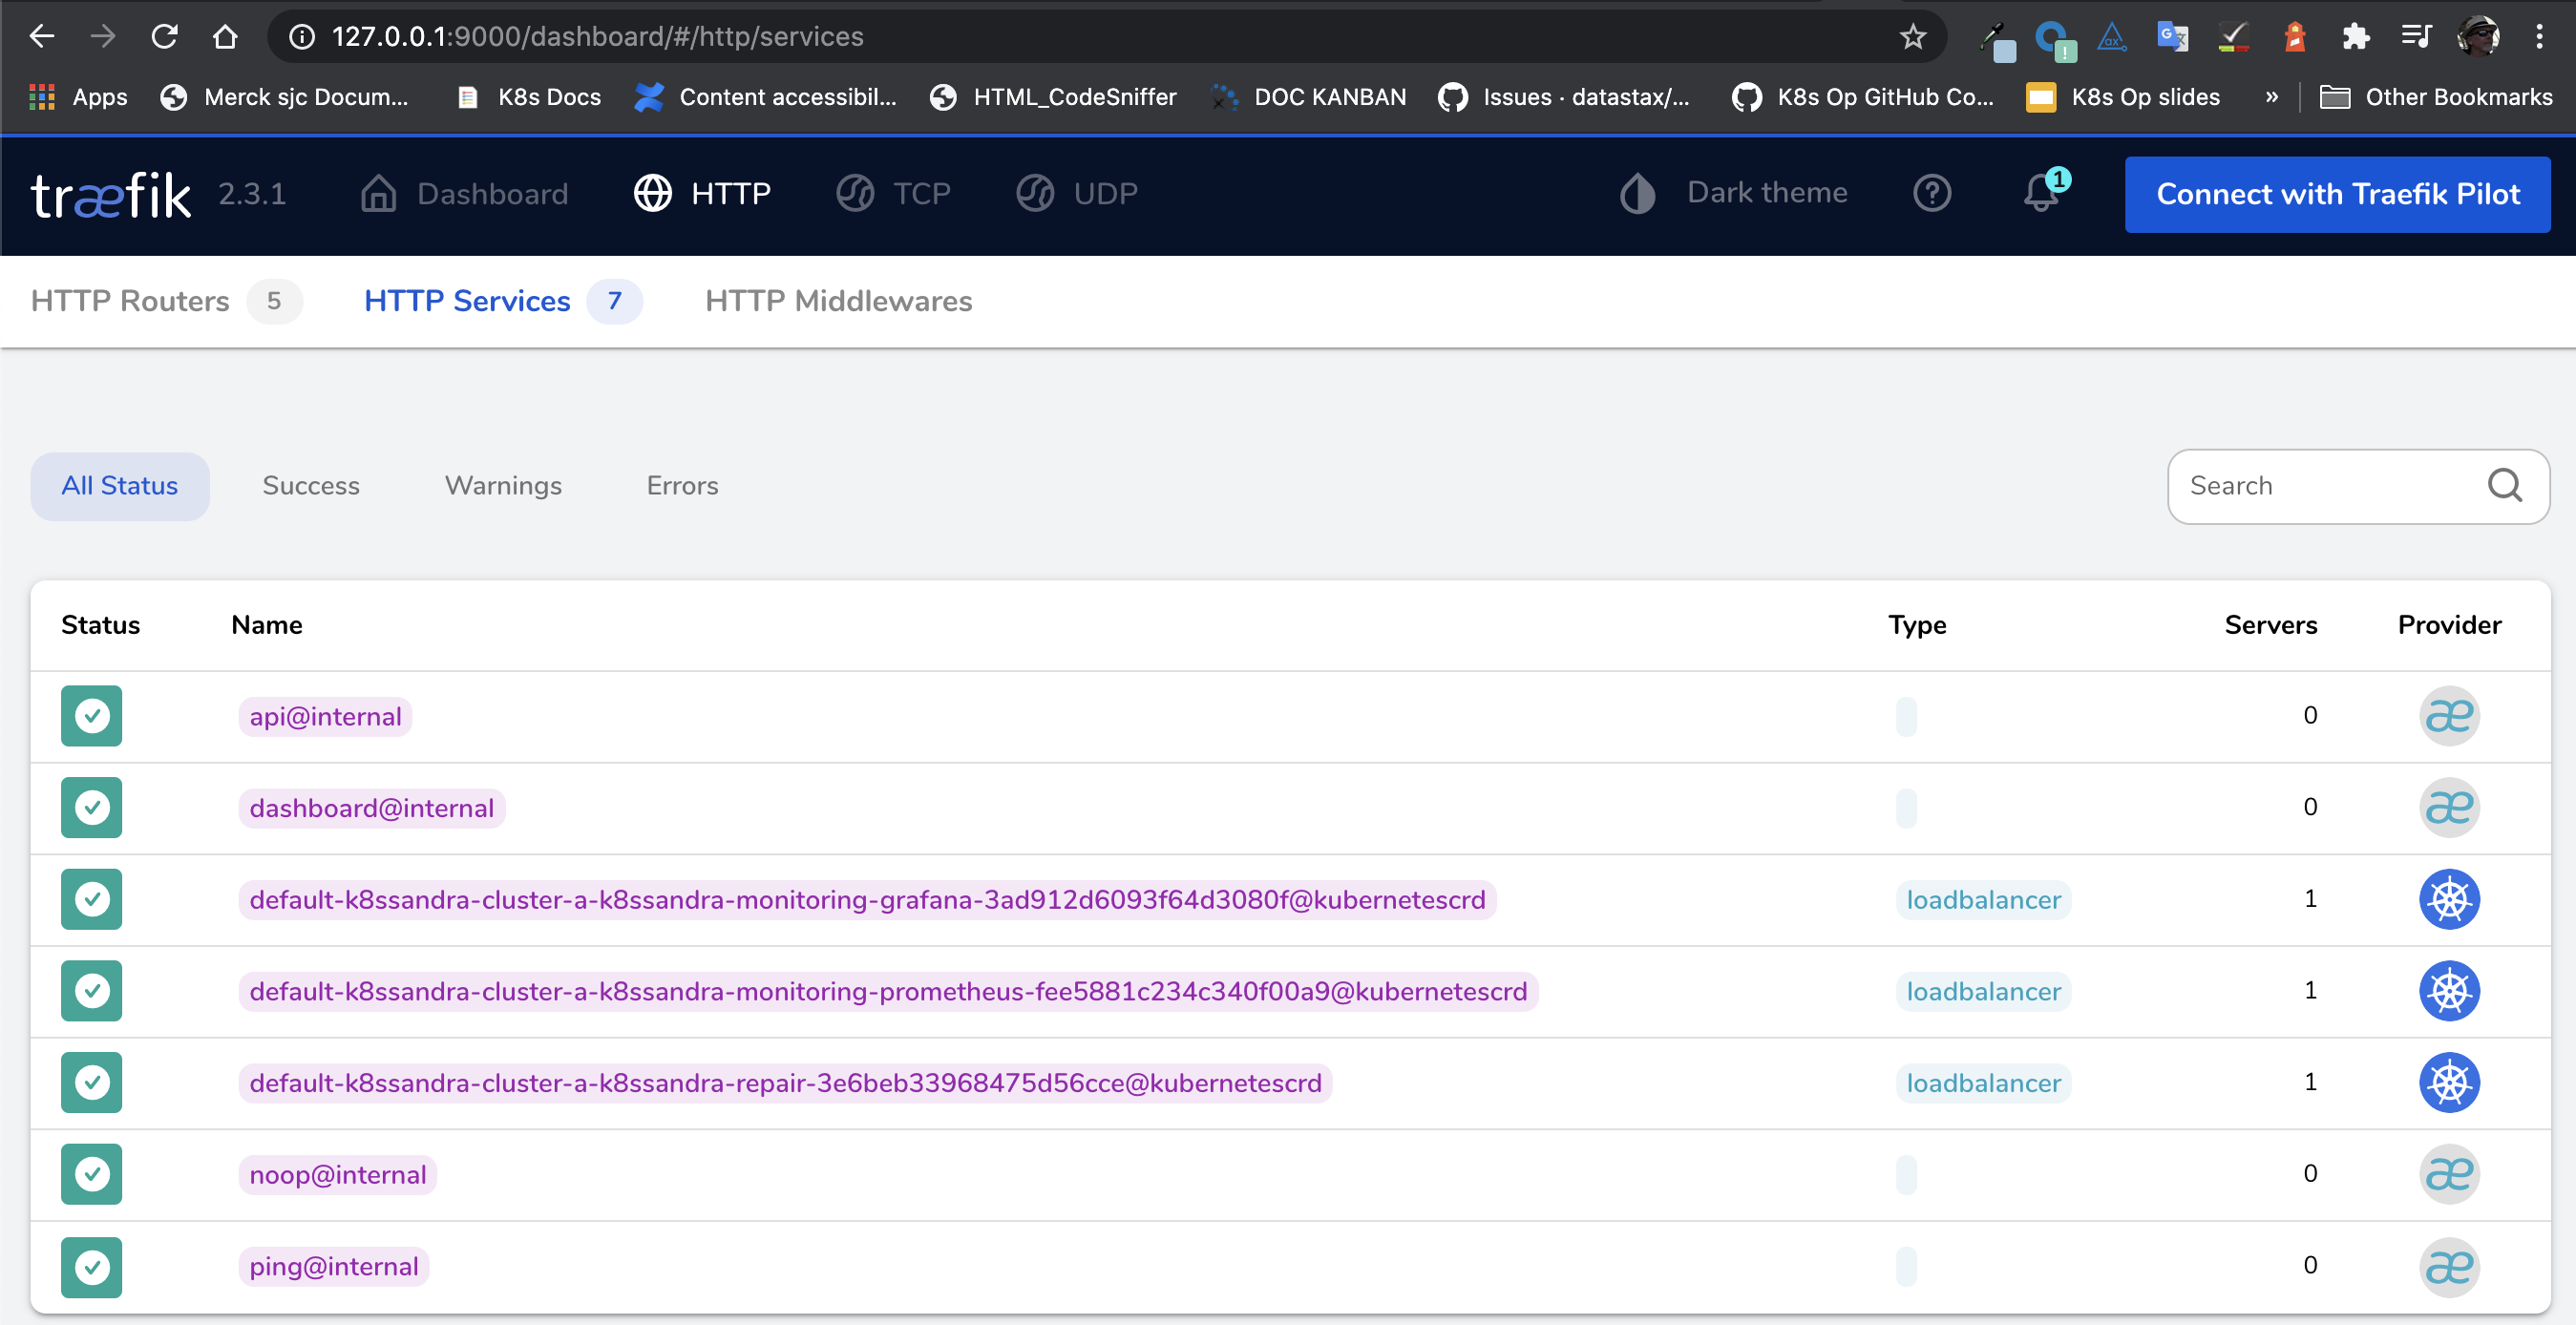
On this page, you’ll find entries representing the Prometheus and Grafana services. Note the Kubernetes logo to the right of the table indicating that it was provisioned via a Kubernetes custom resource.
Next steps
Feel free to explore the other Traefik ingress topics.
Also, learn how the steps to use the monitoring features in Grafana, which is preconfigured to visualize the Cassandra and related metrics.
Feedback
Was this page helpful?
Glad to hear it! Please tell us how we can improve.
Sorry to hear that. Please tell us how we can improve.